Sales Territory Mapping: Visualize Territories in Minutes

Turn territory assignments into clear, professional maps. Color-code regions by rep, revenue tier, or any metric you track. Share with your team in seconds.

No sign up required.

Ultimaps editor showing completed US territory map with five sales reps assigned to color-coded regions

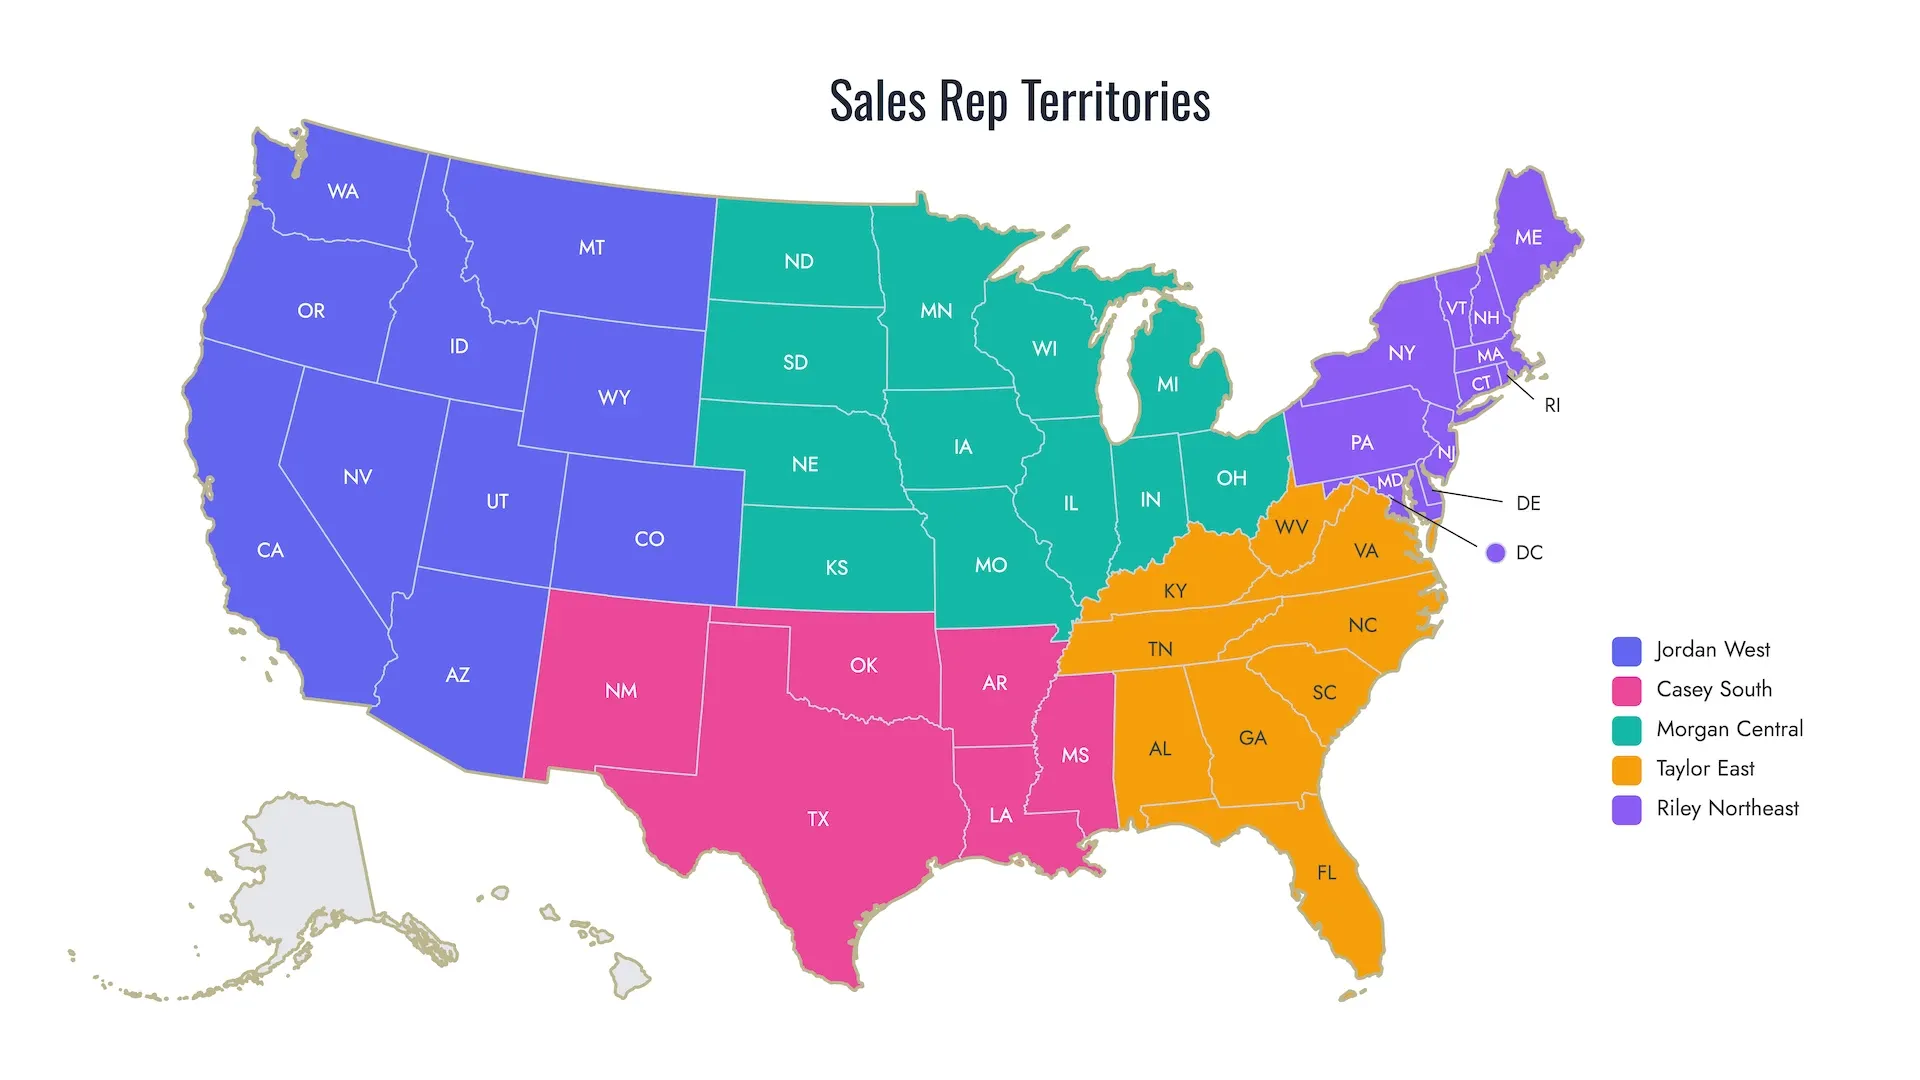
The Territory Visibility Problem

Your sales territories exist somewhere between a spreadsheet, three email threads, and that whiteboard photo from last quarter's planning session. When someone asks "who owns this account?" the answer takes longer than it should.

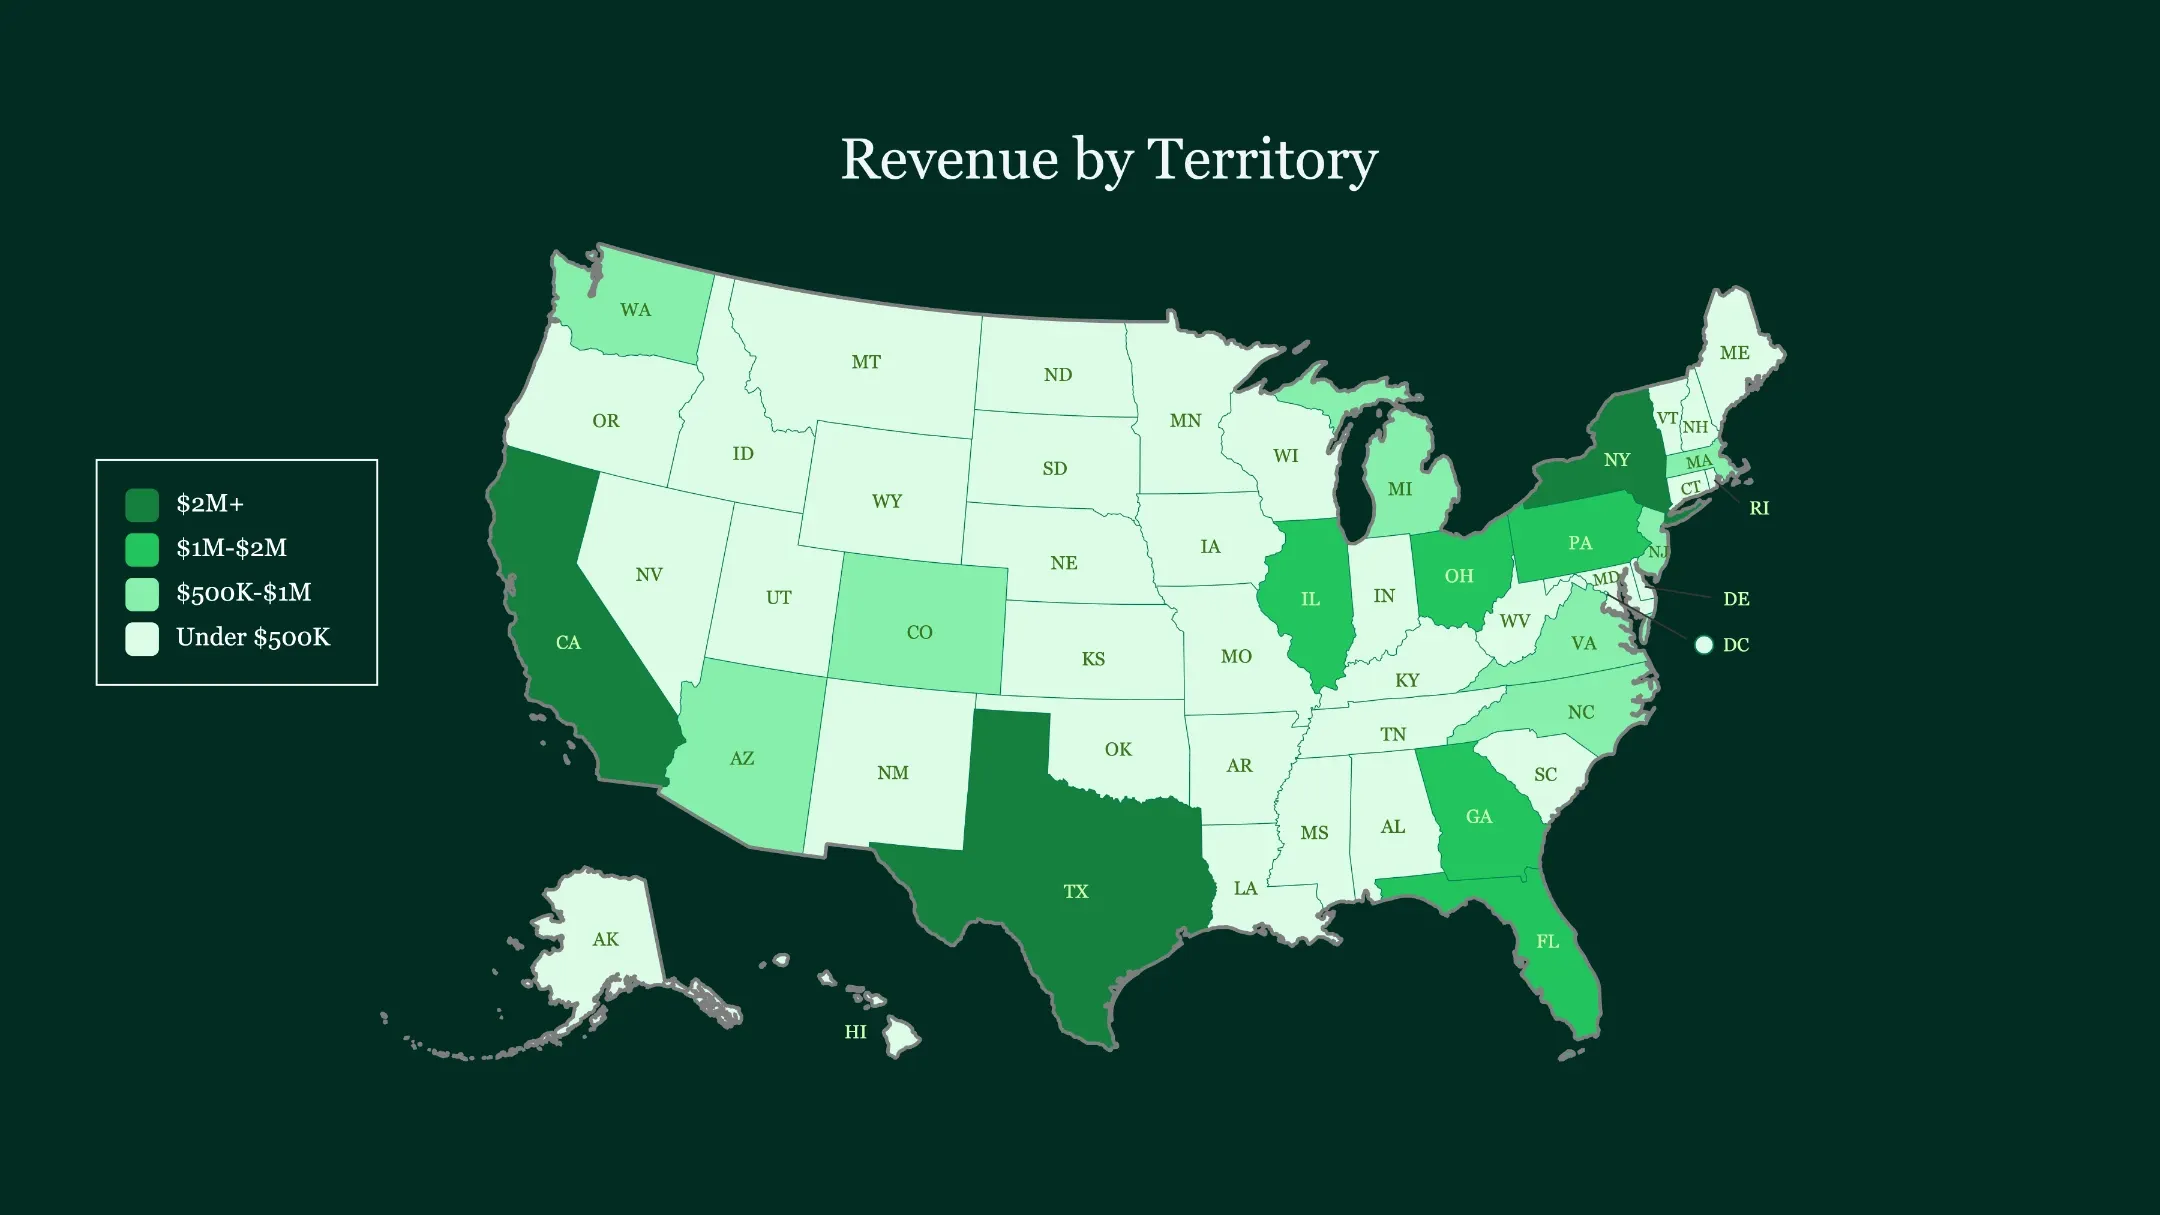
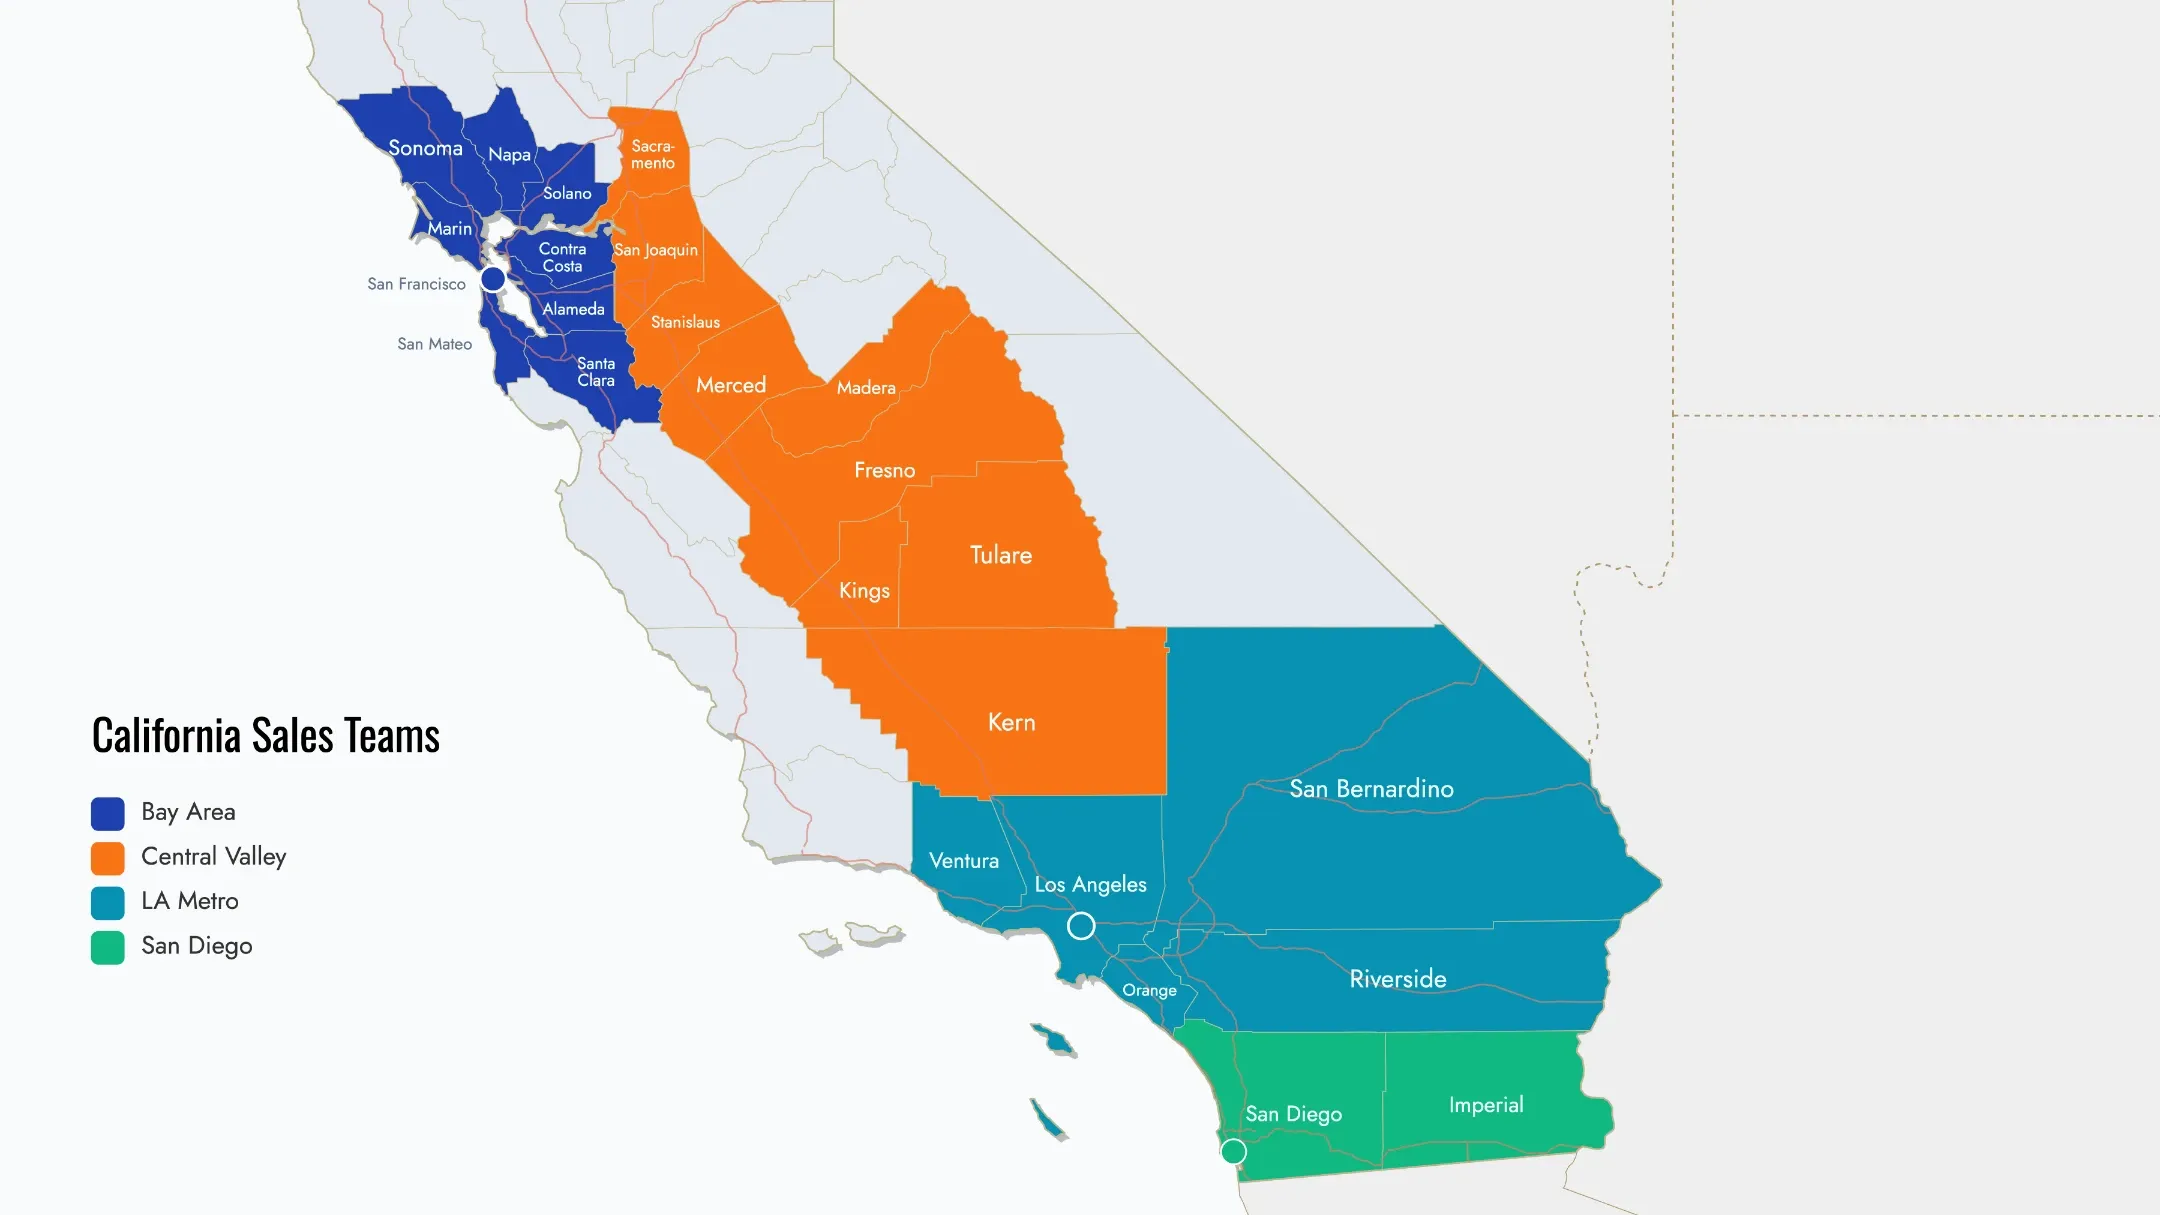
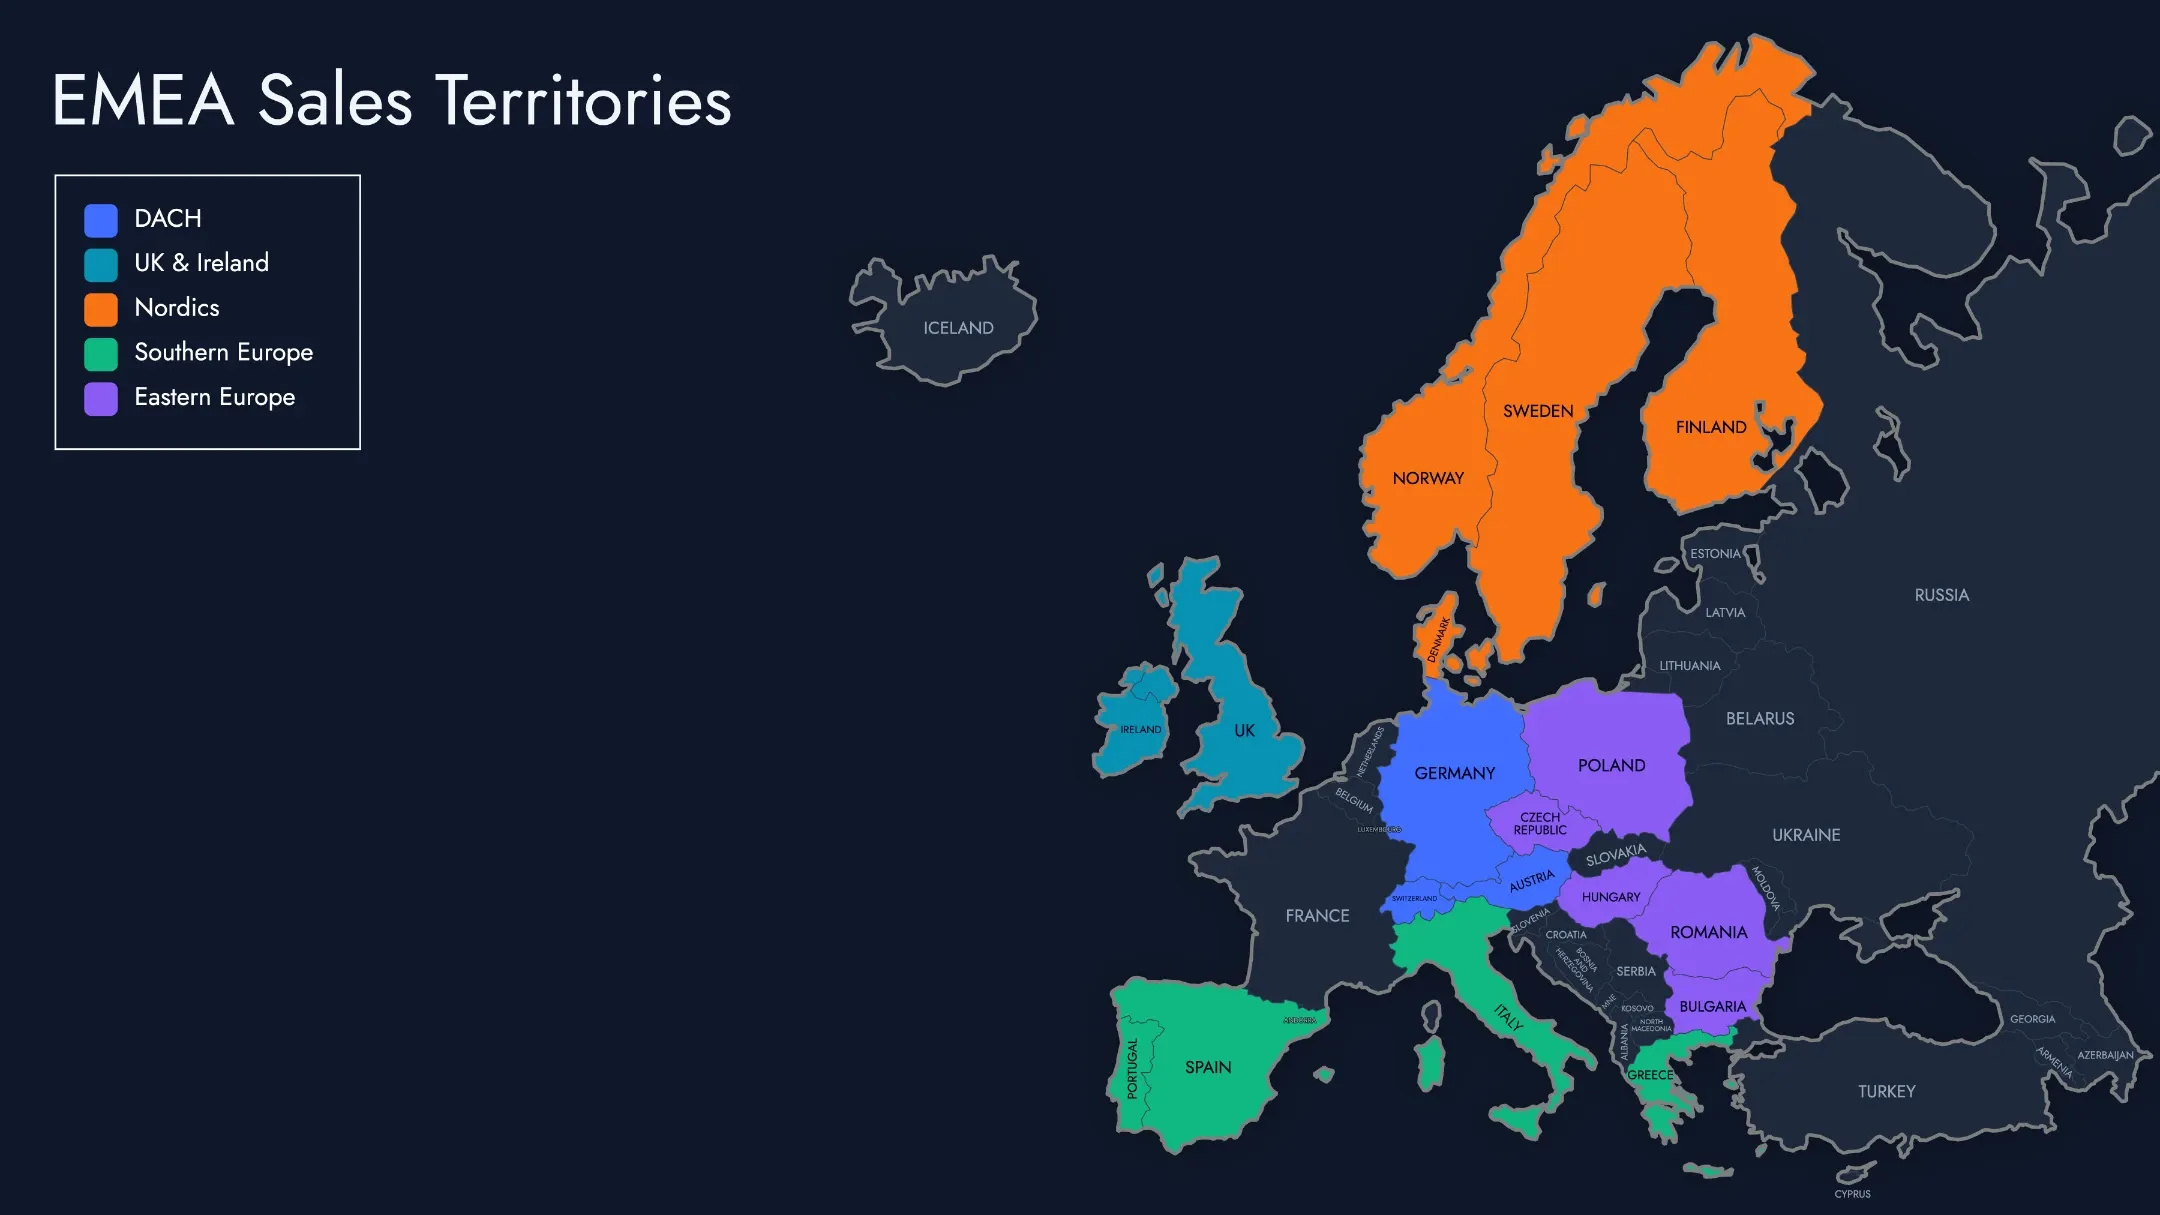
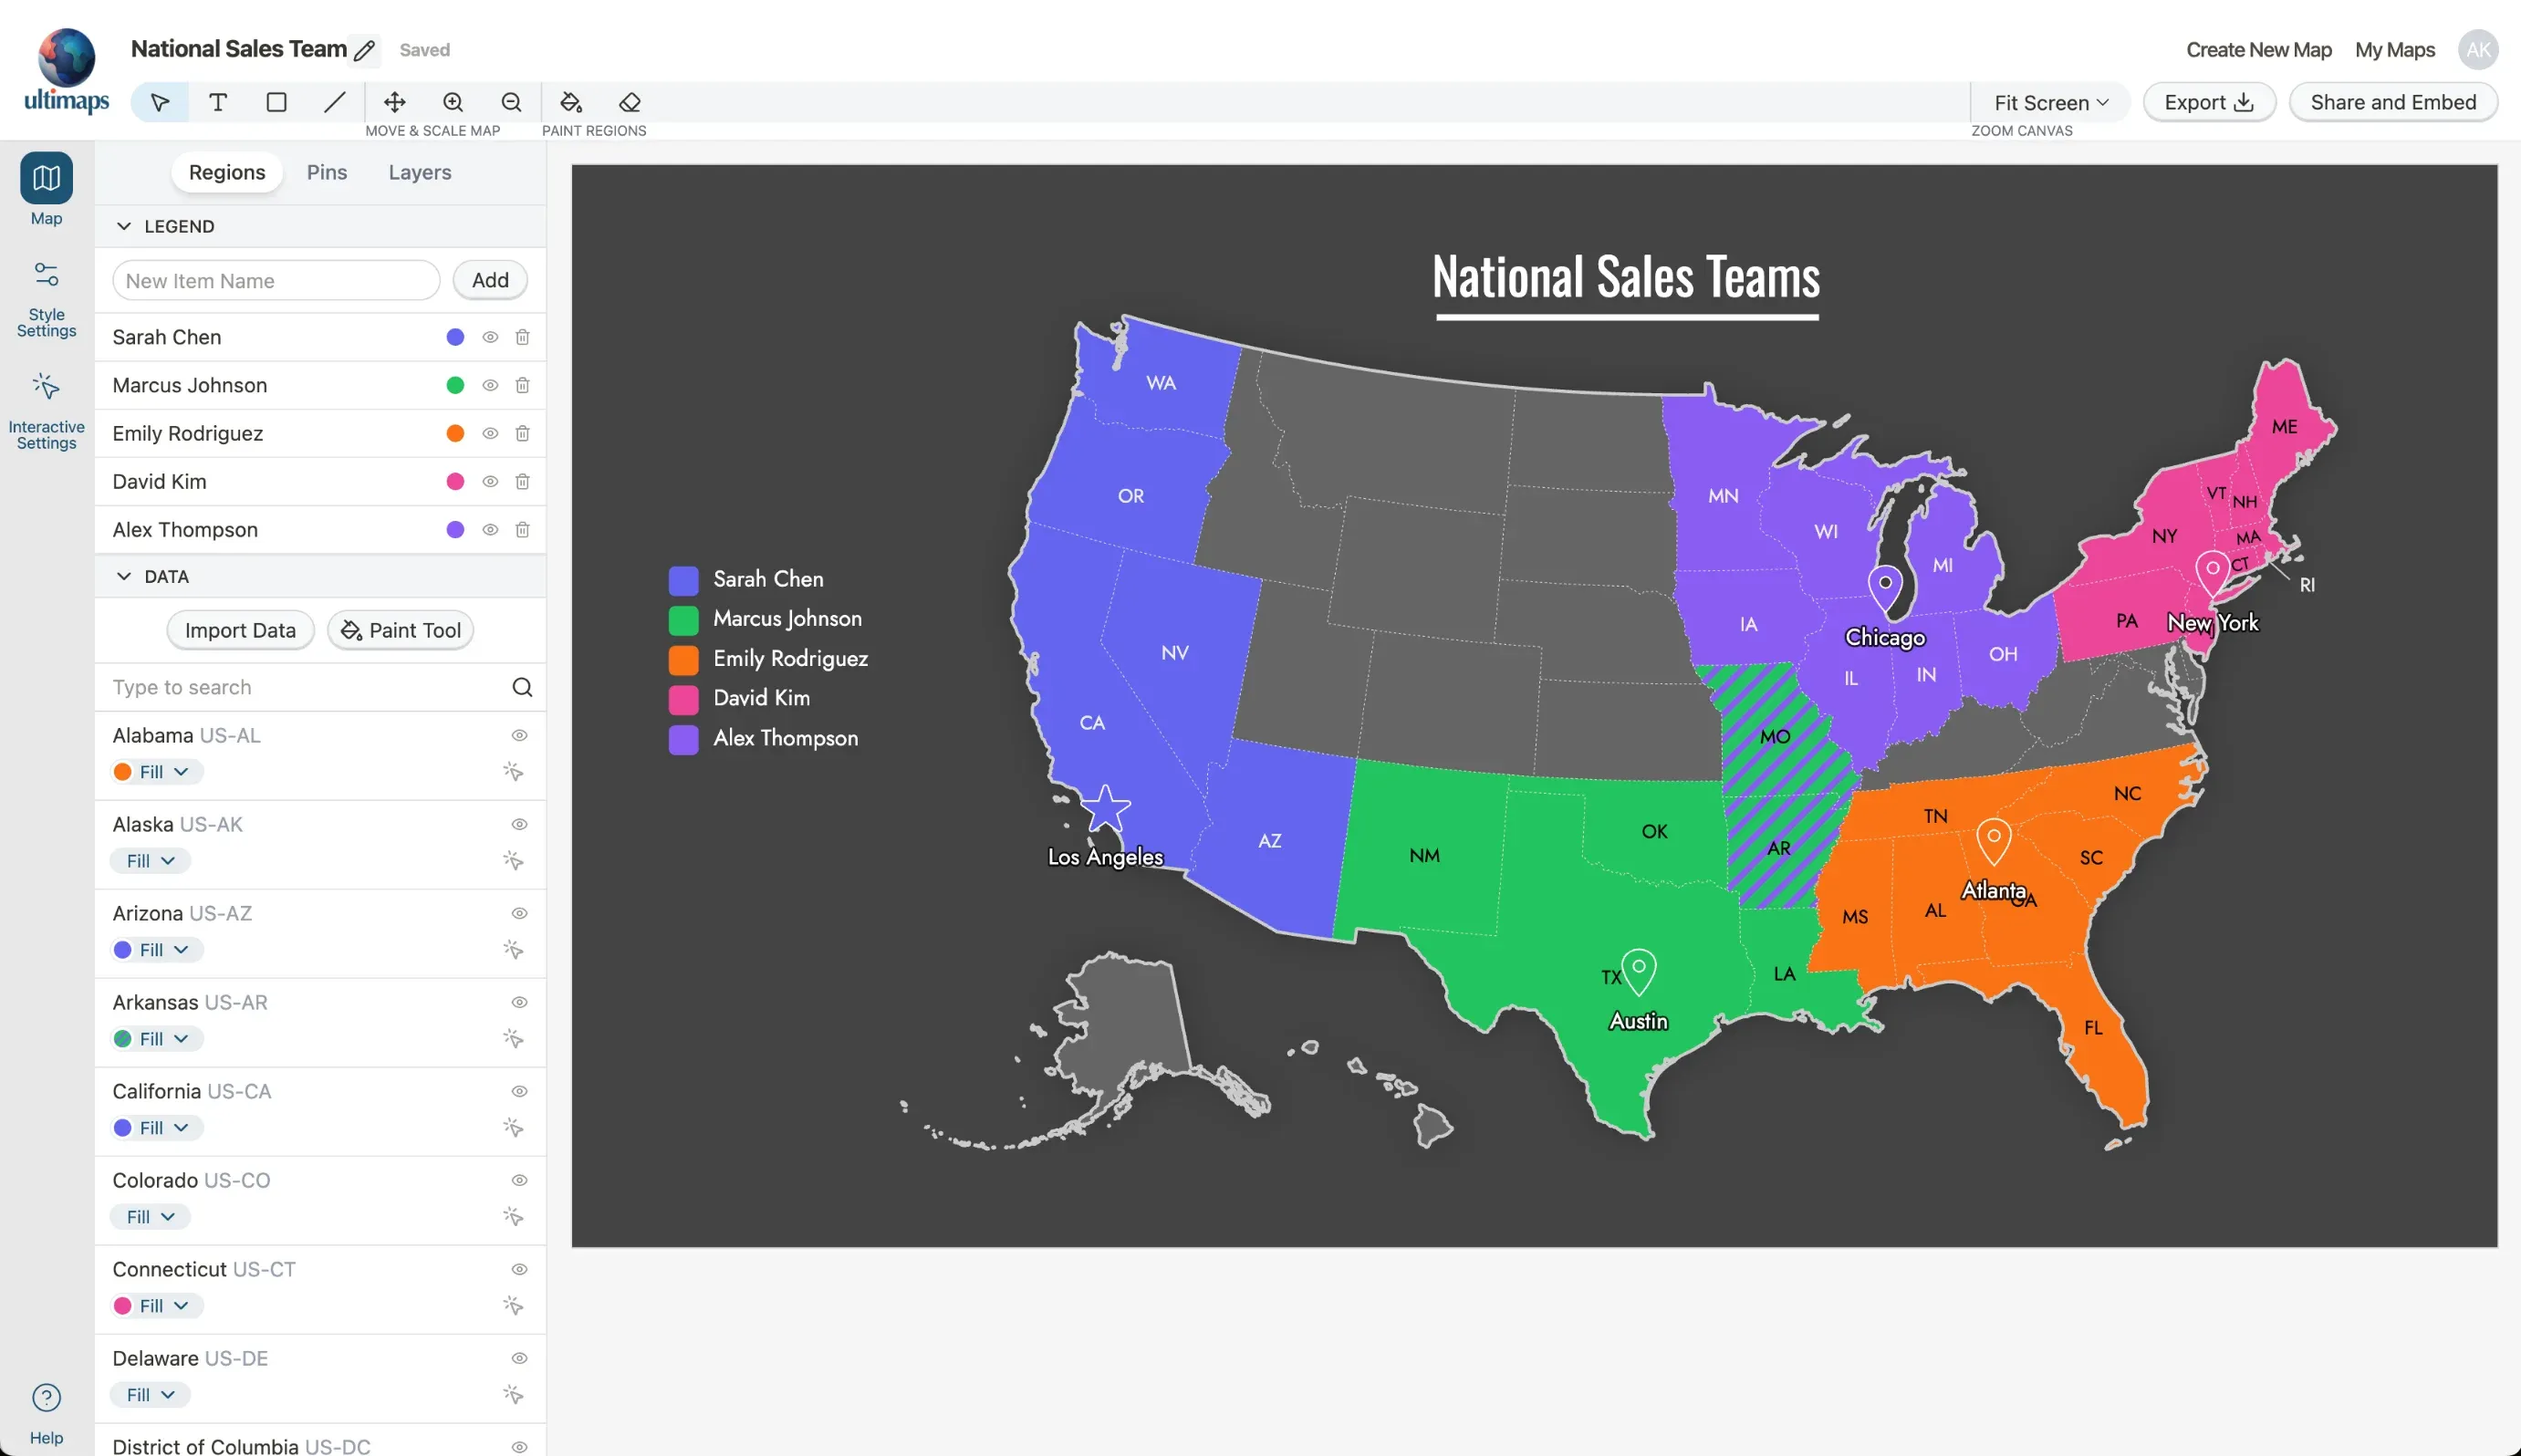
Sales territory mapping software gives you a visual source of truth. You see exactly which rep owns which region, where accounts cluster, and how territories compare at a glance.

Ultimaps helps sales operations teams create, visualize, and share territory maps. Export polished maps for presentations or embed interactive versions in your sales portal. No GIS experience required.

What Is Sales Territory Mapping Software?

Sales territory mapping software turns your territory assignments into visual maps. Instead of describing territories in spreadsheets or slide decks, you see clear boundaries on an actual map.

The software lets you:

  • Visualize territories as color-coded regions on a map
  • Import account data to see where customers and prospects are located
  • Create clear boundaries by state, county, or country
  • Share maps through exports, links, or embedded views

This isn't route planning or territory optimization software. Ultimaps focuses on visualization: helping you communicate territory assignments clearly so everyone knows who owns what.

Think of it as the difference between describing directions and showing someone a map. Both convey the same information, but one is immediately clear.

How to Create a Territory Map in Ultimaps

  1. Select Your Base Map

    Choose from US states, individual state counties (like California or Texas), Canadian provinces, European countries, or world countries. Pick the geographic level that matches your territory structure.

  2. Import Your Territory Data

    Upload a CSV, XLSX, or connect to Google Docs or Notion with your regions mapped to territories or sales reps. Ultimaps automatically colors the regions and generates a legend. Alternatively, use the AI prompt to describe your territories in natural language.

  3. Fine-Tune Your Boundaries

    Adjust any regions that need reassigning using the bucket fill tool: select a color, then click regions to update them. You can also hide regions that aren't part of any sales territory.

  4. Add Account Pins (Optional)

    Import a CSV with account addresses. Ultimaps geocodes them and places pins on your map. See whether your territory boundaries align with where accounts are located.

  5. Style Your Map

    Choose a theme or style it yourself. Adjust borders and fonts. Set the background color. Make it match your brand or presentation style.

  6. Export or Share

    Download as PNG, SVG, or PDF. Generate a share link for browser viewing. Copy embed code to embed into your website or internal portal. Your map is ready to use.

Why Sales Teams Use Ultimaps

  • Full Customization

    Match your brand colors. Choose from multiple themes. Style borders, backgrounds, and labels to fit your presentations.

  • No Learning Curve

    Point and click to create territories. No GIS training needed. Most teams create their first map in under 15 minutes.

  • Easy Sharing

    Export for slide decks. Embed in your wiki. Share links that always show the current version.

  • Multiple Views

    Create different maps for different audiences. Rep assignments for the team, revenue tiers for leadership, regional views for managers.

  • Global Coverage

    Map territories across the US, Canada, Europe, or worldwide. State, county, and country-level boundaries included.

  • AI-Assisted Creation

    Describe your territories in plain English. The AI colors your map based on your instructions. Refine manually as needed.

What Territory Mapping Software Does (and Doesn't Do)

Ultimaps is a visualization tool. It helps you create clear, professional maps that communicate territory assignments to your team, leadership, and stakeholders.

What you can do:

  • Create visual territory maps by coloring regions
  • Import account data to see customer locations as pins
  • Build maps showing rep assignments, revenue tiers, or any categorization
  • Export high-quality images for presentations
  • Share interactive maps your team can explore
  • Maintain a visual source of truth for territory ownership

What Ultimaps doesn't do:

  • Optimize or balance territories automatically
  • Plan sales routes or daily schedules
  • Sync directly with CRM systems (you'll export from your CRM and import into Ultimaps)
  • Calculate travel times or distances
  • Assign leads automatically based on location

If you need territory optimization algorithms or route planning, you'll want dedicated tools for those functions. Ultimaps complements those tools by giving you a clear way to visualize and communicate the results.

Territory Visualization: Ultimaps vs. Alternatives

CapabilityUltimapsSpreadsheetsPowerPointGoogle MapsEnterprise GIS
Color-coded territory boundariesManual drawing
Professional map stylingLimited
Import account locationsN/AManual pins
No technical skills needed
High-resolution exports
Interactive sharingLimitedVaries
Time to create15-30 minHoursHoursHoursDays/Weeks
CostFree plan availableFreeIncludedFree$$$$

Territory Map Examples

US map with five sales rep territories in distinct colors covering all states

Rep Assignment Map

Five reps, five territories, clearly visualized. Each rep sees their region at a glance.

US revenue map with darkest green showing top-revenue states California, Texas, and New York

Revenue Tier Visualization

Color-code territories by revenue contribution. See which regions drive the most business.

California county map with four sales team territories covering Bay Area, LA, Central Valley, and San Diego

County-Level Detail

Drill down to county boundaries for metro-area territories. Essential for local sales teams.

European territory map with five regions color-coded by language and geography

Global Territory Maps

Visualize worldwide coverage. Color-code by region, market maturity, or any categorization relevant to your organization.

Common Use Cases

Communicating Territory Assignments

The most common use: creating a clear visual that shows which rep owns which region. Share at sales kickoffs, include in onboarding materials, post in your team wiki. When territories are visible, there's less confusion about ownership.

Leadership Presentations

Board meetings and QBRs need polished visuals. Export high-resolution maps that show your sales organization structure, regional performance, or market coverage. Maps communicate faster than tables.

Documenting Territory Changes

When you reorganize territories, create before and after maps. Visual comparison helps the team understand what changed and why. Keep historical maps to track how your organization has evolved.

Visualizing Account Distribution

Import your account data to see where customers cluster. This helps validate whether your territory boundaries make sense given where business actually happens.

New Hire Onboarding

Give new reps a map of their territory on day one. They immediately understand their geographic scope and can reference it as they learn accounts.

Coverage Analysis

Color-code regions by whether you have active accounts there. White space on the map shows where you might have gaps. This informs conversations about expansion, not automated recommendations.

Who Uses Territory Mapping Software?

Sales Operations Managers create and maintain territory maps. They need tools that make updates fast and sharing easy.

VP of Sales and CROs present territory structures to leadership. They need professional visuals that communicate clearly.

Territory Managers reference maps to understand their regions. They share maps with their teams to align on coverage.

Field Sales Reps want to know exactly what's theirs. Interactive maps they can access anytime reduce confusion.

Revenue Operations Teams use territory maps alongside other planning tools. Visual maps help validate assumptions and communicate plans.

Industries Using Territory Maps

  • Pharmaceutical Sales

    Visualize territories by region or account type. Show coverage across hospitals, clinics, and physician offices.

  • B2B Technology

    Map territories by geography or market segment. Visualize enterprise vs. mid-market coverage.

  • Manufacturing & Distribution

    Show territories relative to distribution centers. Visualize customer locations and regional assignments.

  • Insurance & Financial Services

    Map agent territories by state or county. Visualize policy distribution across regions.

  • Real Estate

    Define agent territories by neighborhood or county. Show listing coverage visually.

  • Field Services

    Visualize technician territories. Show service area boundaries clearly.

Tips for Effective Territory Maps

Use distinct colors. Choose colors that are easy to tell apart, especially for adjacent territories. Avoid using too many similar shades.

Keep legends clear. Use descriptive labels. "Northeast Region" is clearer than "Region 4." Rep names work well for assignment maps.

Match the right geographic level. State-level works for national overviews. County-level works for detailed local coverage. Don't use more detail than you need.

Add context with pins. Importing account locations helps validate that your territory boundaries make sense. Clusters of pins should fall within the right territories.

Update regularly. Territories change. Keep your maps current so they remain useful. Outdated maps cause more confusion than no maps.

Create multiple views. Different audiences need different information. Leadership might want revenue tiers. Reps want assignment maps. Create versions for each use case.

Frequently Asked Questions

Ultimaps has a free plan that lets you create unlimited maps and export standard-resolution PNGs with a small attribution. For high-resolution exports without attribution, you can pay per map or subscribe for unlimited exports. Pricing details are on our pricing page.

You can export your accounts from Salesforce, HubSpot, or any CRM as a CSV file, then import that file into Ultimaps. The software geocodes addresses automatically and places them as pins on your map. You can also use Google Sheets sharing link to import your data.

No. Ultimaps is designed for business users. If you can use a spreadsheet, you can create territory maps. Click to assign regions, choose colors, and export. Most users create their first map in under 30 minutes.

No. Ultimaps is a visualization tool, not a territory planning or optimization tool. You decide how to divide territories, and Ultimaps helps you visualize and communicate those decisions clearly. For automated territory balancing, you'd need a dedicated optimization tool.

Ultimaps currently supports state-level and county-level boundaries in the US, plus country-level boundaries globally. Contact us about custom map creation for specific needs.

Three options: Export as PNG, SVG, or PDF and attach to emails or presentations. Generate a share link that anyone can view in their browser. Or embed the interactive map in Notion, Confluence, or your internal wiki using the embed code.

Yes. Interactive maps work on any device with a web browser. Reps can view territories, zoom in, and explore on phones or tablets.

Your data stays in your browser during map creation. When you save a map, it's stored securely in your Ultimaps workspace. If you publish or share a map publicly, others can view the data displayed on it. We don't sell or share your data.

Yes. The free plan gives you full access to map creation with unlimited maps. Test the entire workflow before deciding if you need paid export features.

Territory mapping is about visualizing which rep owns which geographic area. Route planning is about optimizing the sequence of stops for daily travel. Ultimaps focuses on territory visualization. For route optimization, you'd use a dedicated route planning tool.