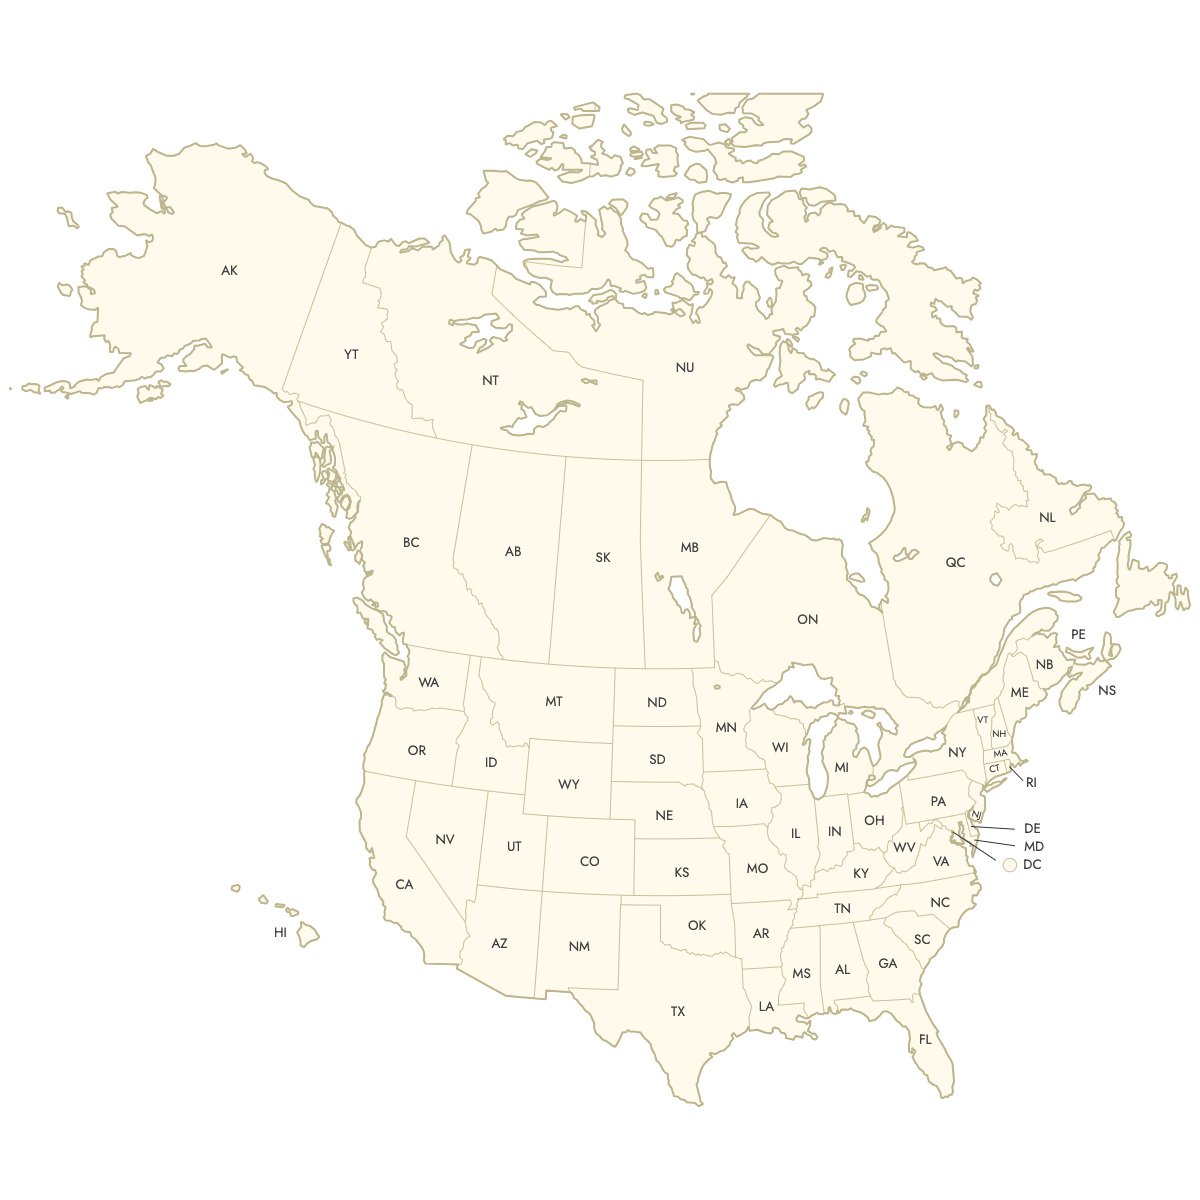
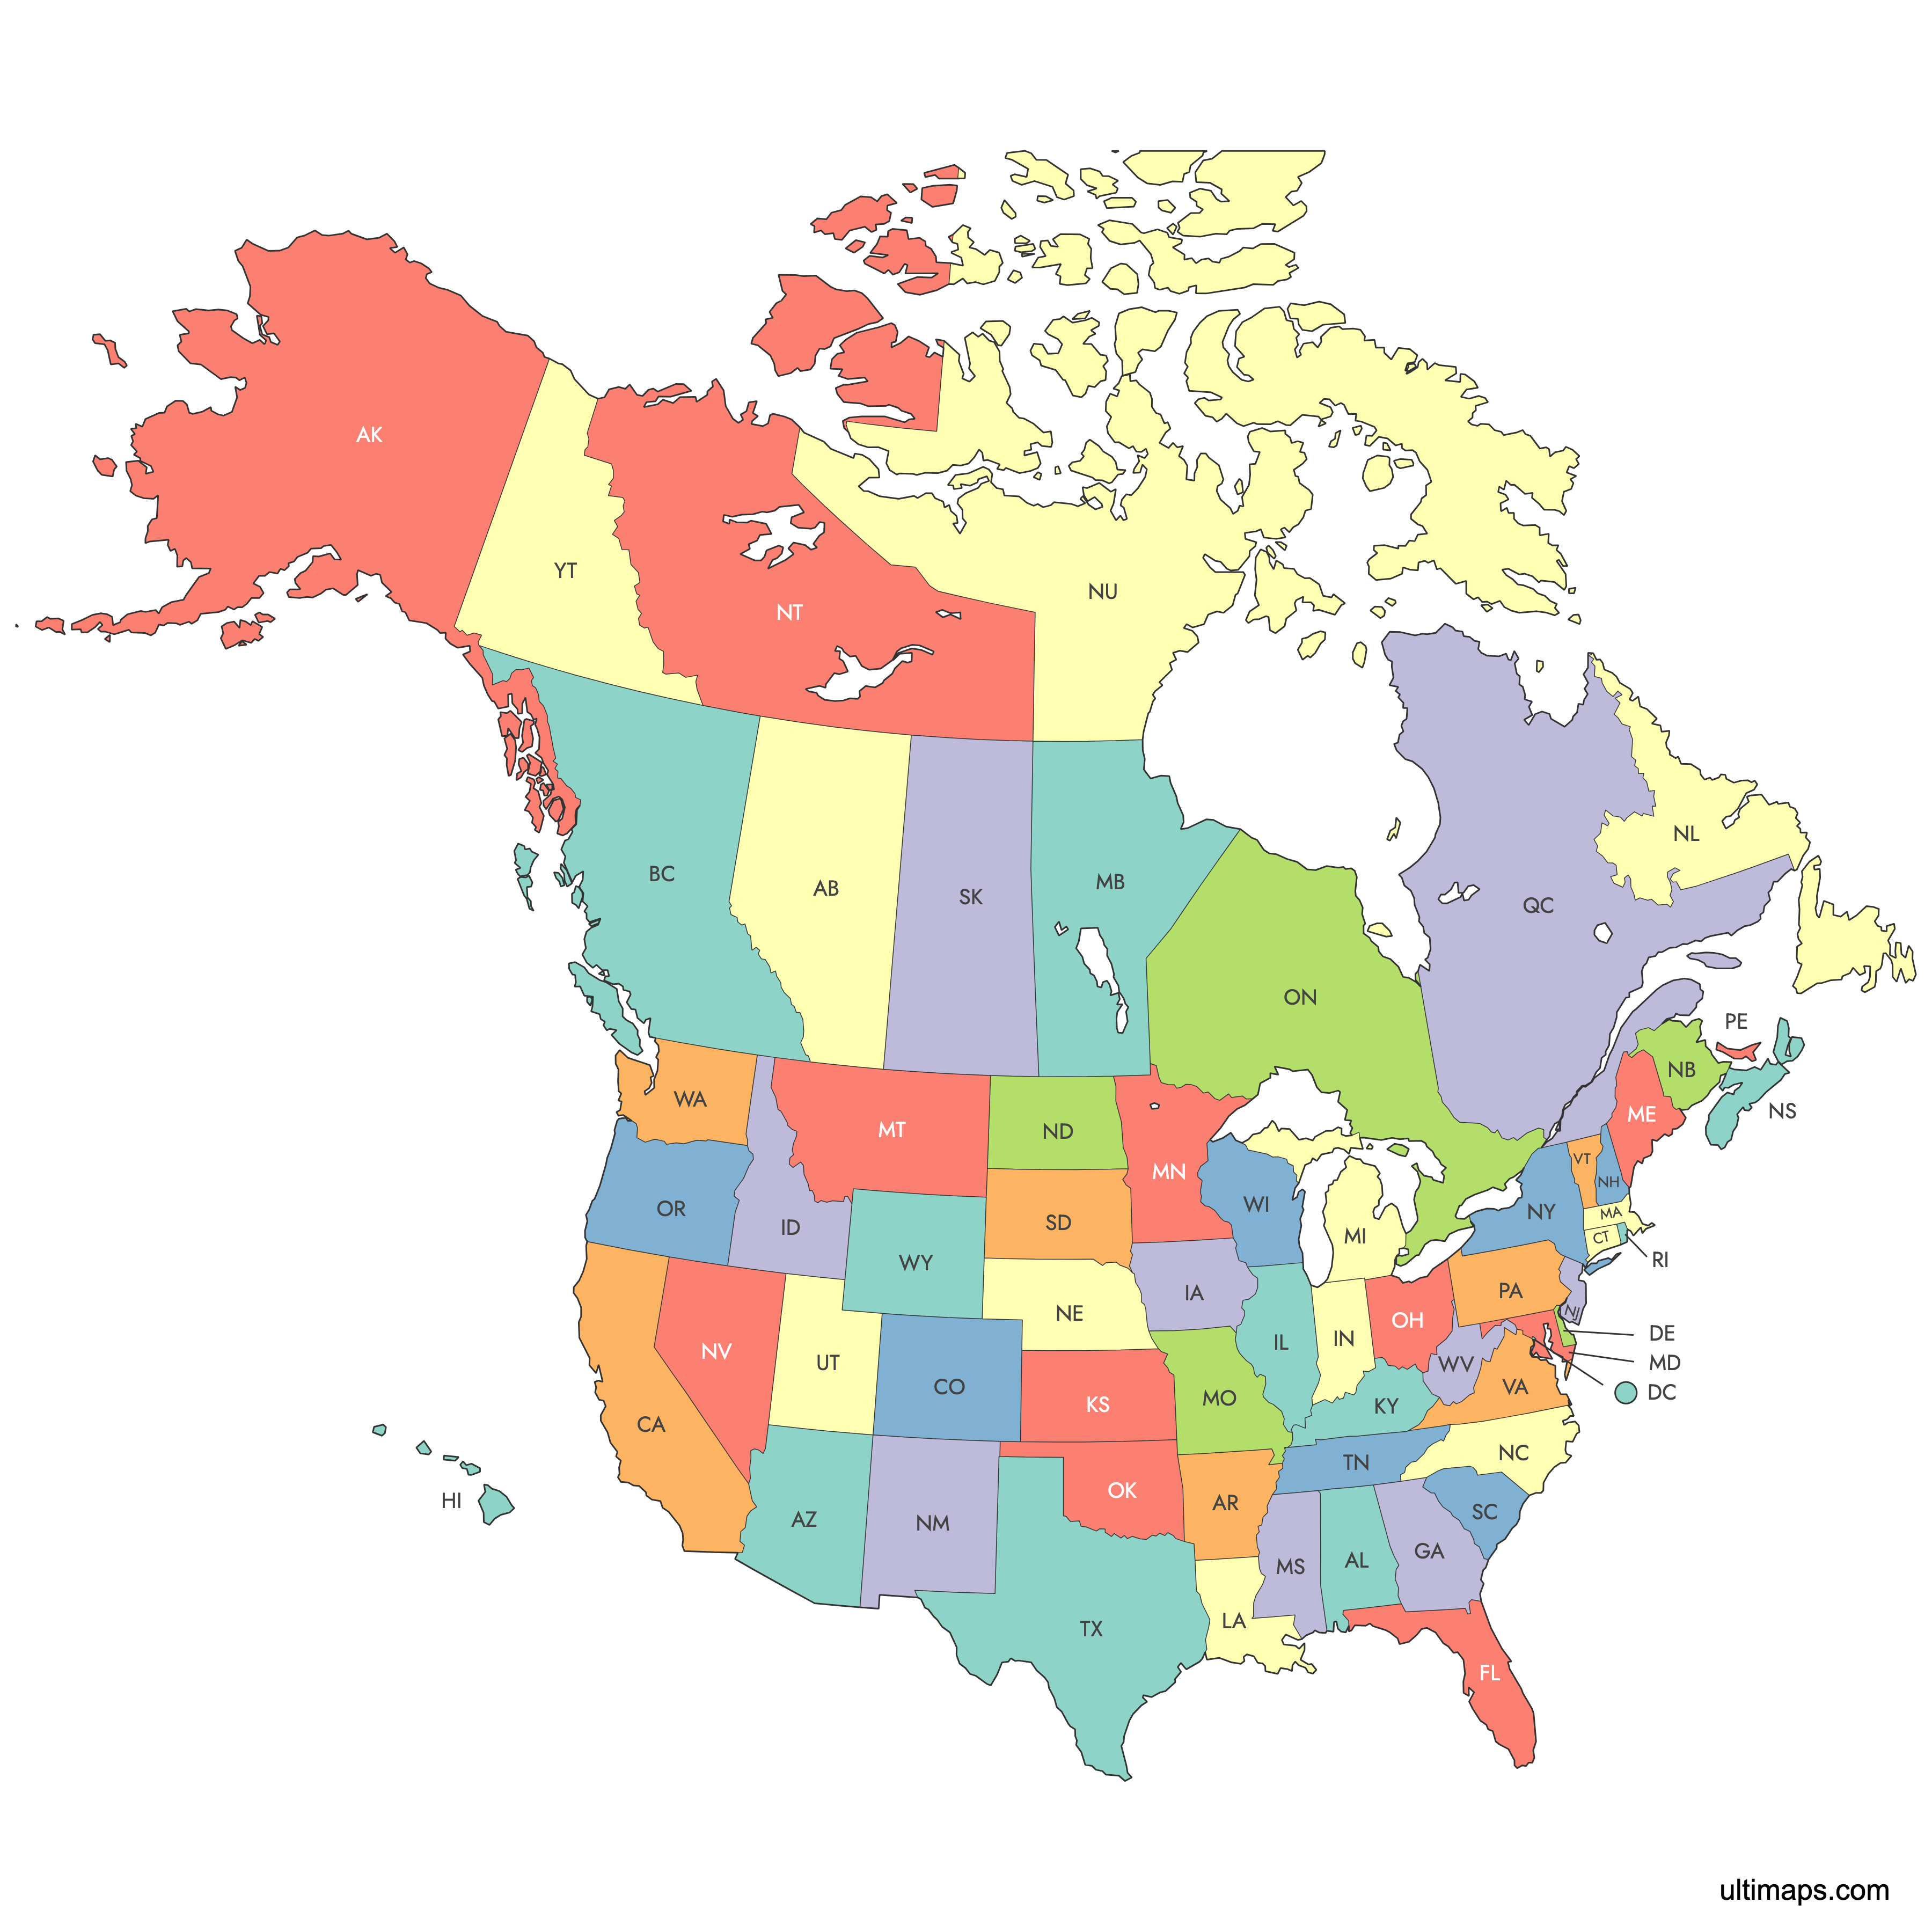
United States and Canada Map
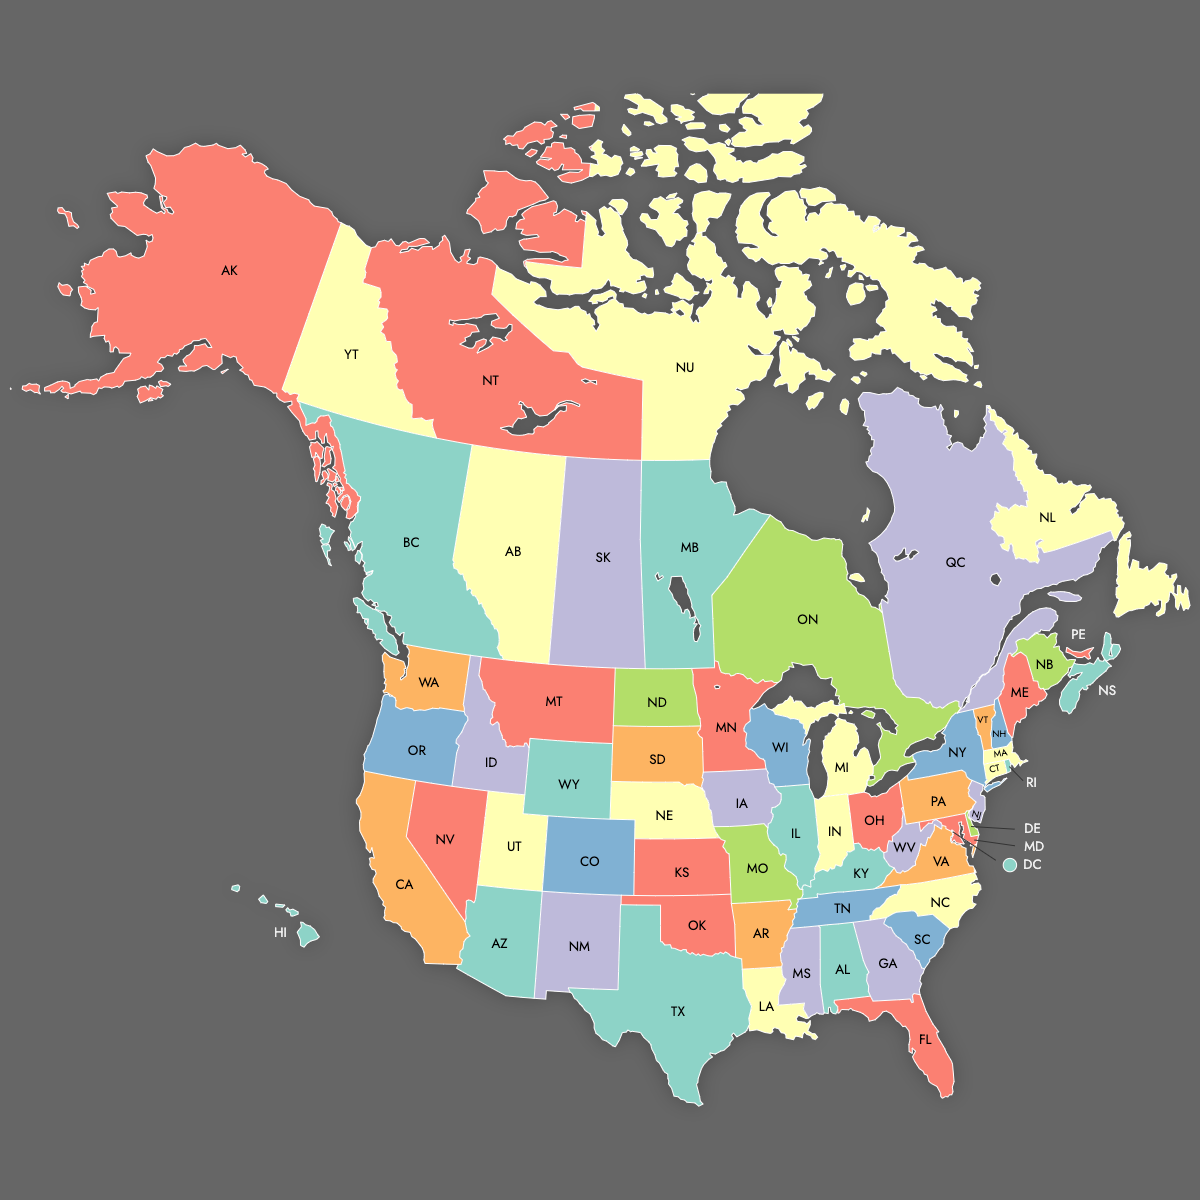
Create a custom map of the United States and Canada divided by their states and provinces. Export your map as a high-resolution PNG, SVG, or PDF, suitable for business reports, data visualization, or web use. You can import data directly from Excel, Google Sheets, or CSV files to automatically color each state or province according to your data, and add pins for key cities or business locations.
Manual coloring is available to highlight specific states or provinces. The app also offers AI suggestions to quickly apply colors based on data input.
If you need an interactive map, you can build one to embed on your website, letting viewers click or hover over each state or province to see additional details or custom information.
Map Details
This map supports labels.
This map is divided into 64 states/provinces:
- Alabama
- Alaska
- Alberta
- Arizona
- Arkansas
- British Columbia
- California
- Colorado
- Connecticut
- Delaware
- District of Columbia
- Florida
- Georgia
- Hawaii
- Idaho
- Illinois
- Indiana
- Iowa
- Kansas
- Kentucky
- Louisiana
- Maine
- Manitoba
- Maryland
- Massachusetts
Check out the related maps below if you're looking for a different map of the same geographic region.
Related Maps
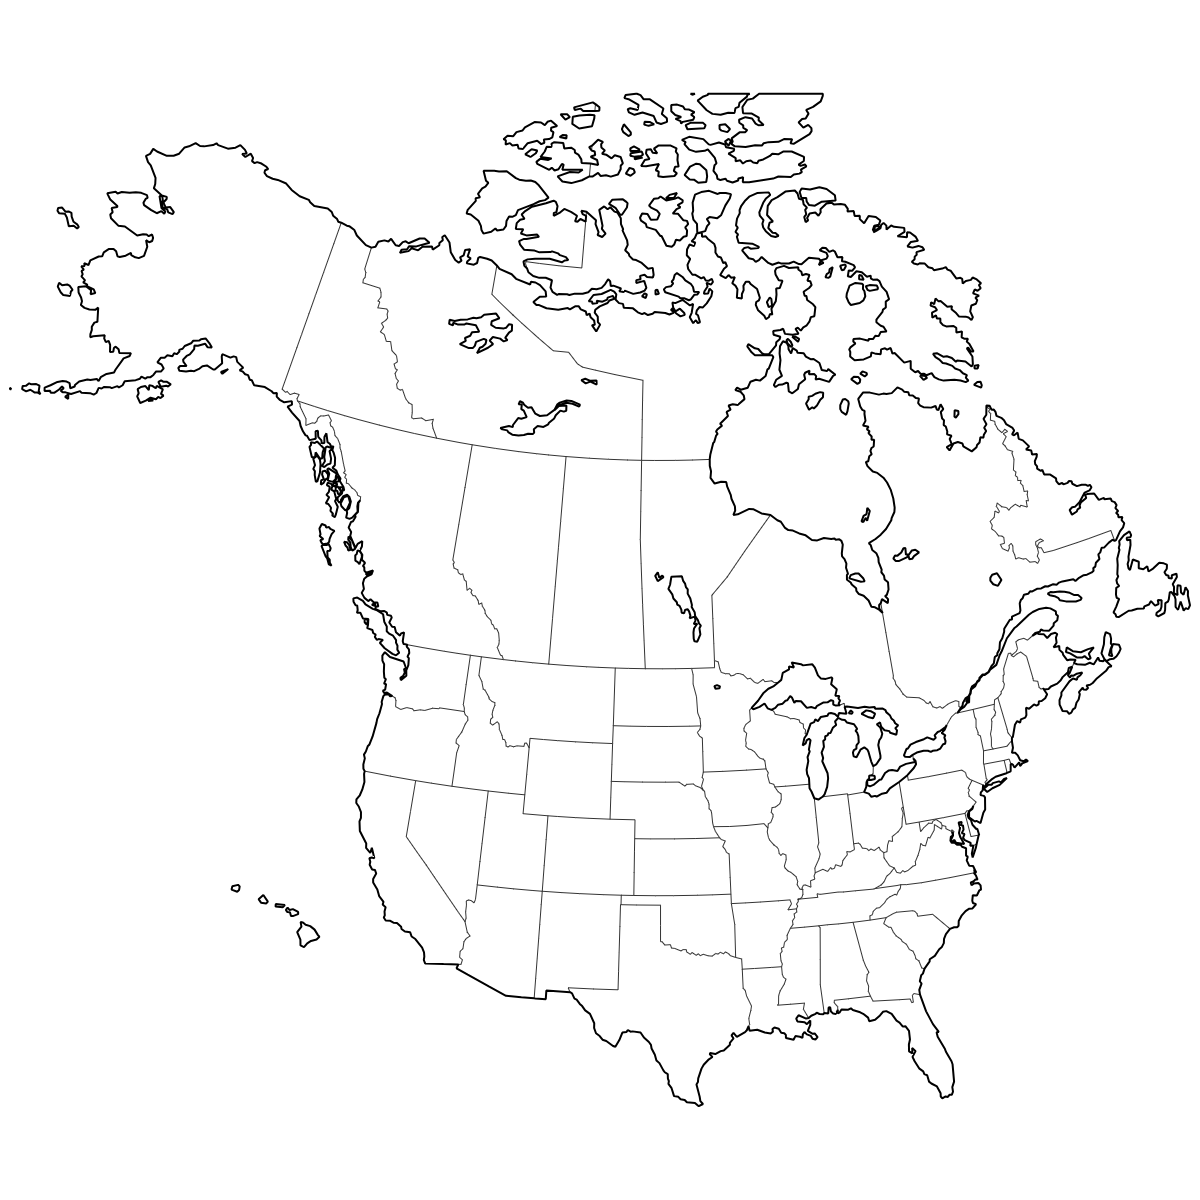
Free Downloads
You can download free blank United States and Canada Map and other maps in high resolution PNG, SVG and PDF formats from the blank maps section of the site: Download Blank United States and Canada Map
About the United States and Canada Map
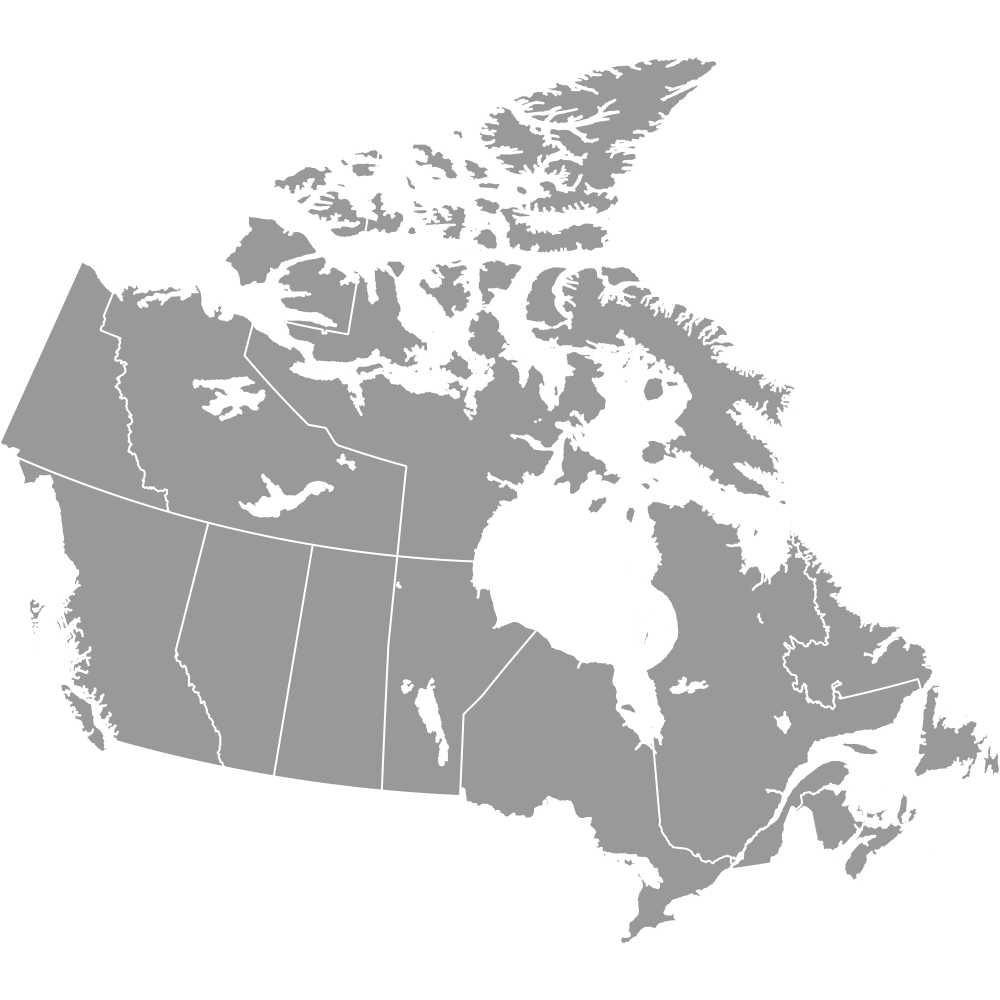
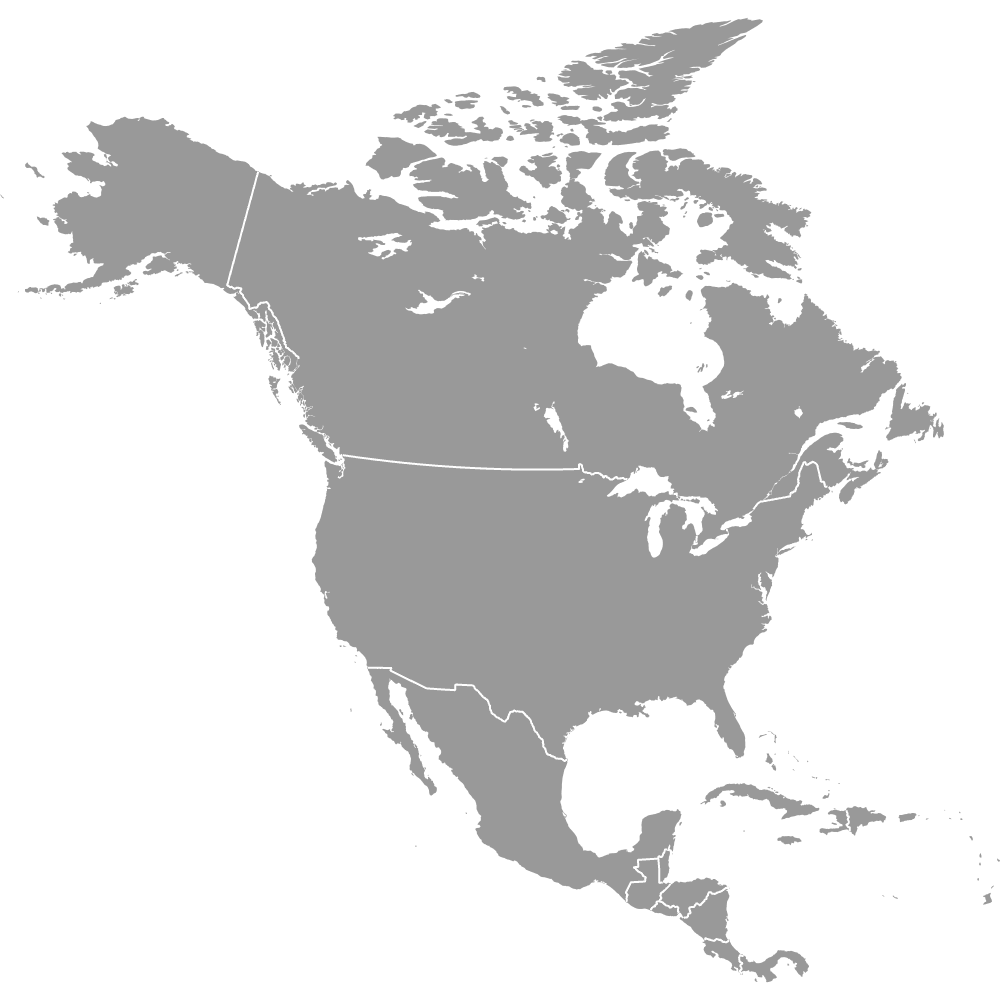
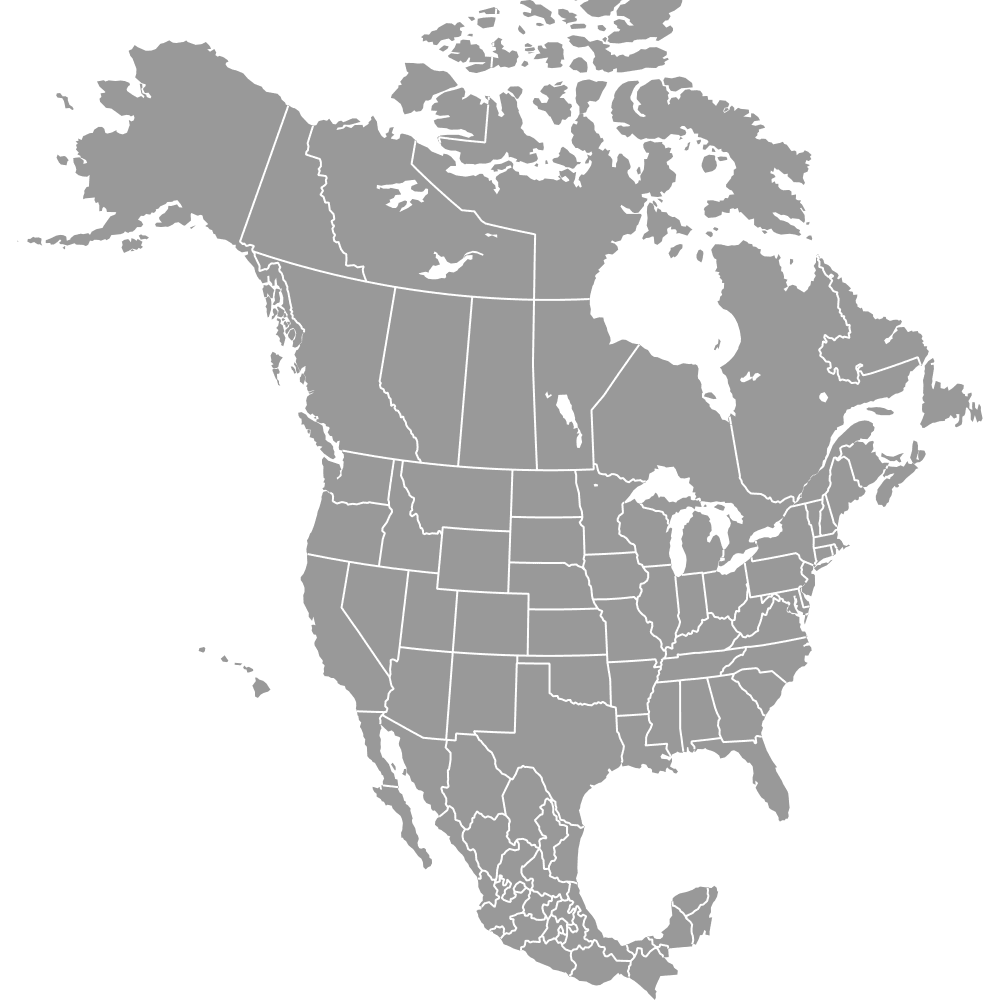
This map displays the United States and Canada with detailed boundaries for each state and province. It is designed for users who need clear administrative divisions for both countries, supporting a variety of business and educational uses. State and province boundaries are current and based on official government data for both countries.
Key facts about the United States and Canada map:
- United States: 50 states and the District of Columbia
- Canada: 10 provinces and 3 territories
- Largest U.S. state by area: Alaska
- Most populous U.S. state: California
- Largest Canadian province/territory by area: Nunavut
- Most populous Canadian province: Ontario
- Both countries share the longest international land border in the world
- Neighboring countries: Mexico (to the south) and Greenland (to the northeast of Canada)
- Major urban centers include New York City, Los Angeles, Toronto, and Vancouver
- The map reflects up-to-date boundaries for all included regions
Updates
Nov 25, 2024:
- Changed the map's projection to move Hawaii closer to the mainland
Nov 12, 2024:
- Added labels
Aug 26, 2024:
- Added map of United States and Canada — States and Provinces