How to color-code map of the world
Whether you're preparing for a business presentation, crafting educational materials, or creating visualizations for social media, this guide will walk you through the process of creating a color coded map of the world with Ultimaps Studio.
The resulting map can be exported as a PNG, SVG or PDF for use in your presentations and publications, or for creating printable maps. Alternatively, you can create an interactive map and share it by generating a shareable link or embedding it in your website.
Ultimaps Studio is a map visualization tool that allows you to create and customize maps and charts right in your browser. Sign-up is not required.
Illustration Maps versus Data-Driven maps
There are two ways of color-coding maps in Ultimaps Studio:
- Importing a dataset (e.g. Excel or CSV file, Google Spreadsheet or Notion Table) and letting the app do the color-coding for you.
- Manually choosing the colors for each country you want to highlight.
In this guide, we will walk you through the steps to manually color countries on a map without importing data files. We call this type of map an "Illustration Map.". We will cover Data-Driven maps in a separate article.
Creating a Map
First, let’s get started with selecting our base map. In our case, it's a map of the world. Head to https://studio.ultimaps.com/ and choose the World option. There are multiple outlines available for the map of the world, such as the map of the world with countries or the map of the world with continents. Let's choose the Map of the World - Countries template for our example.
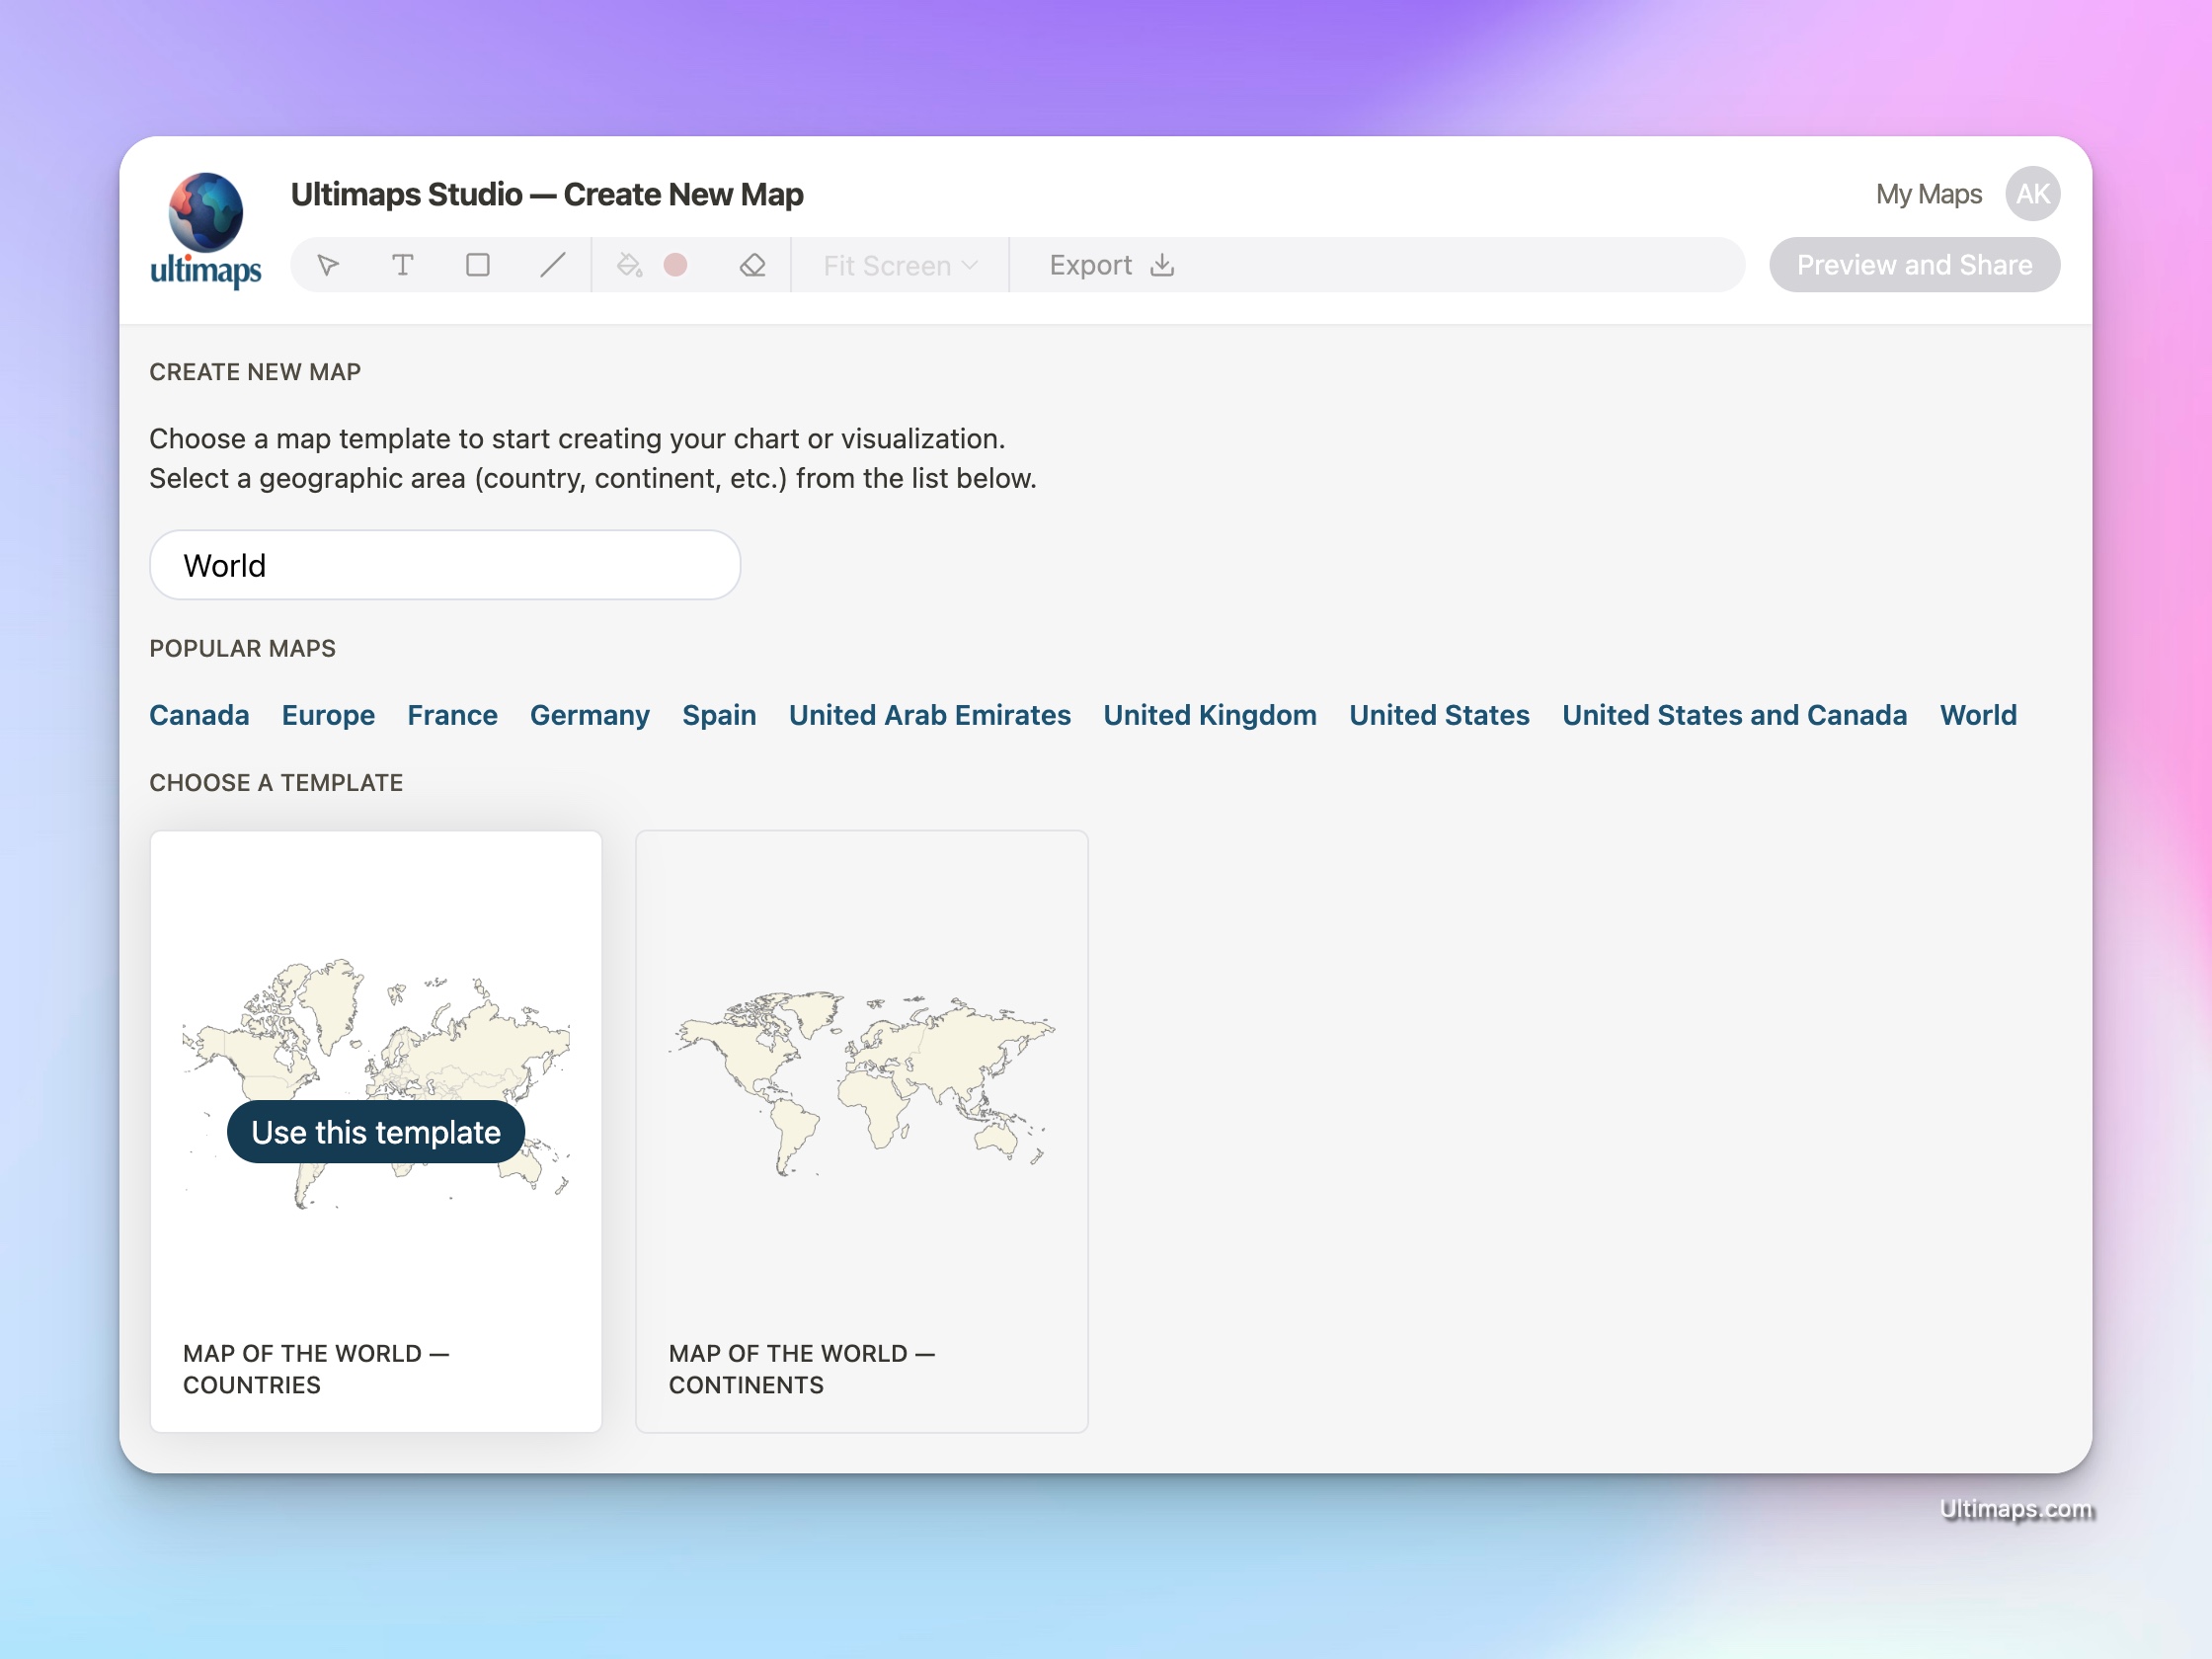
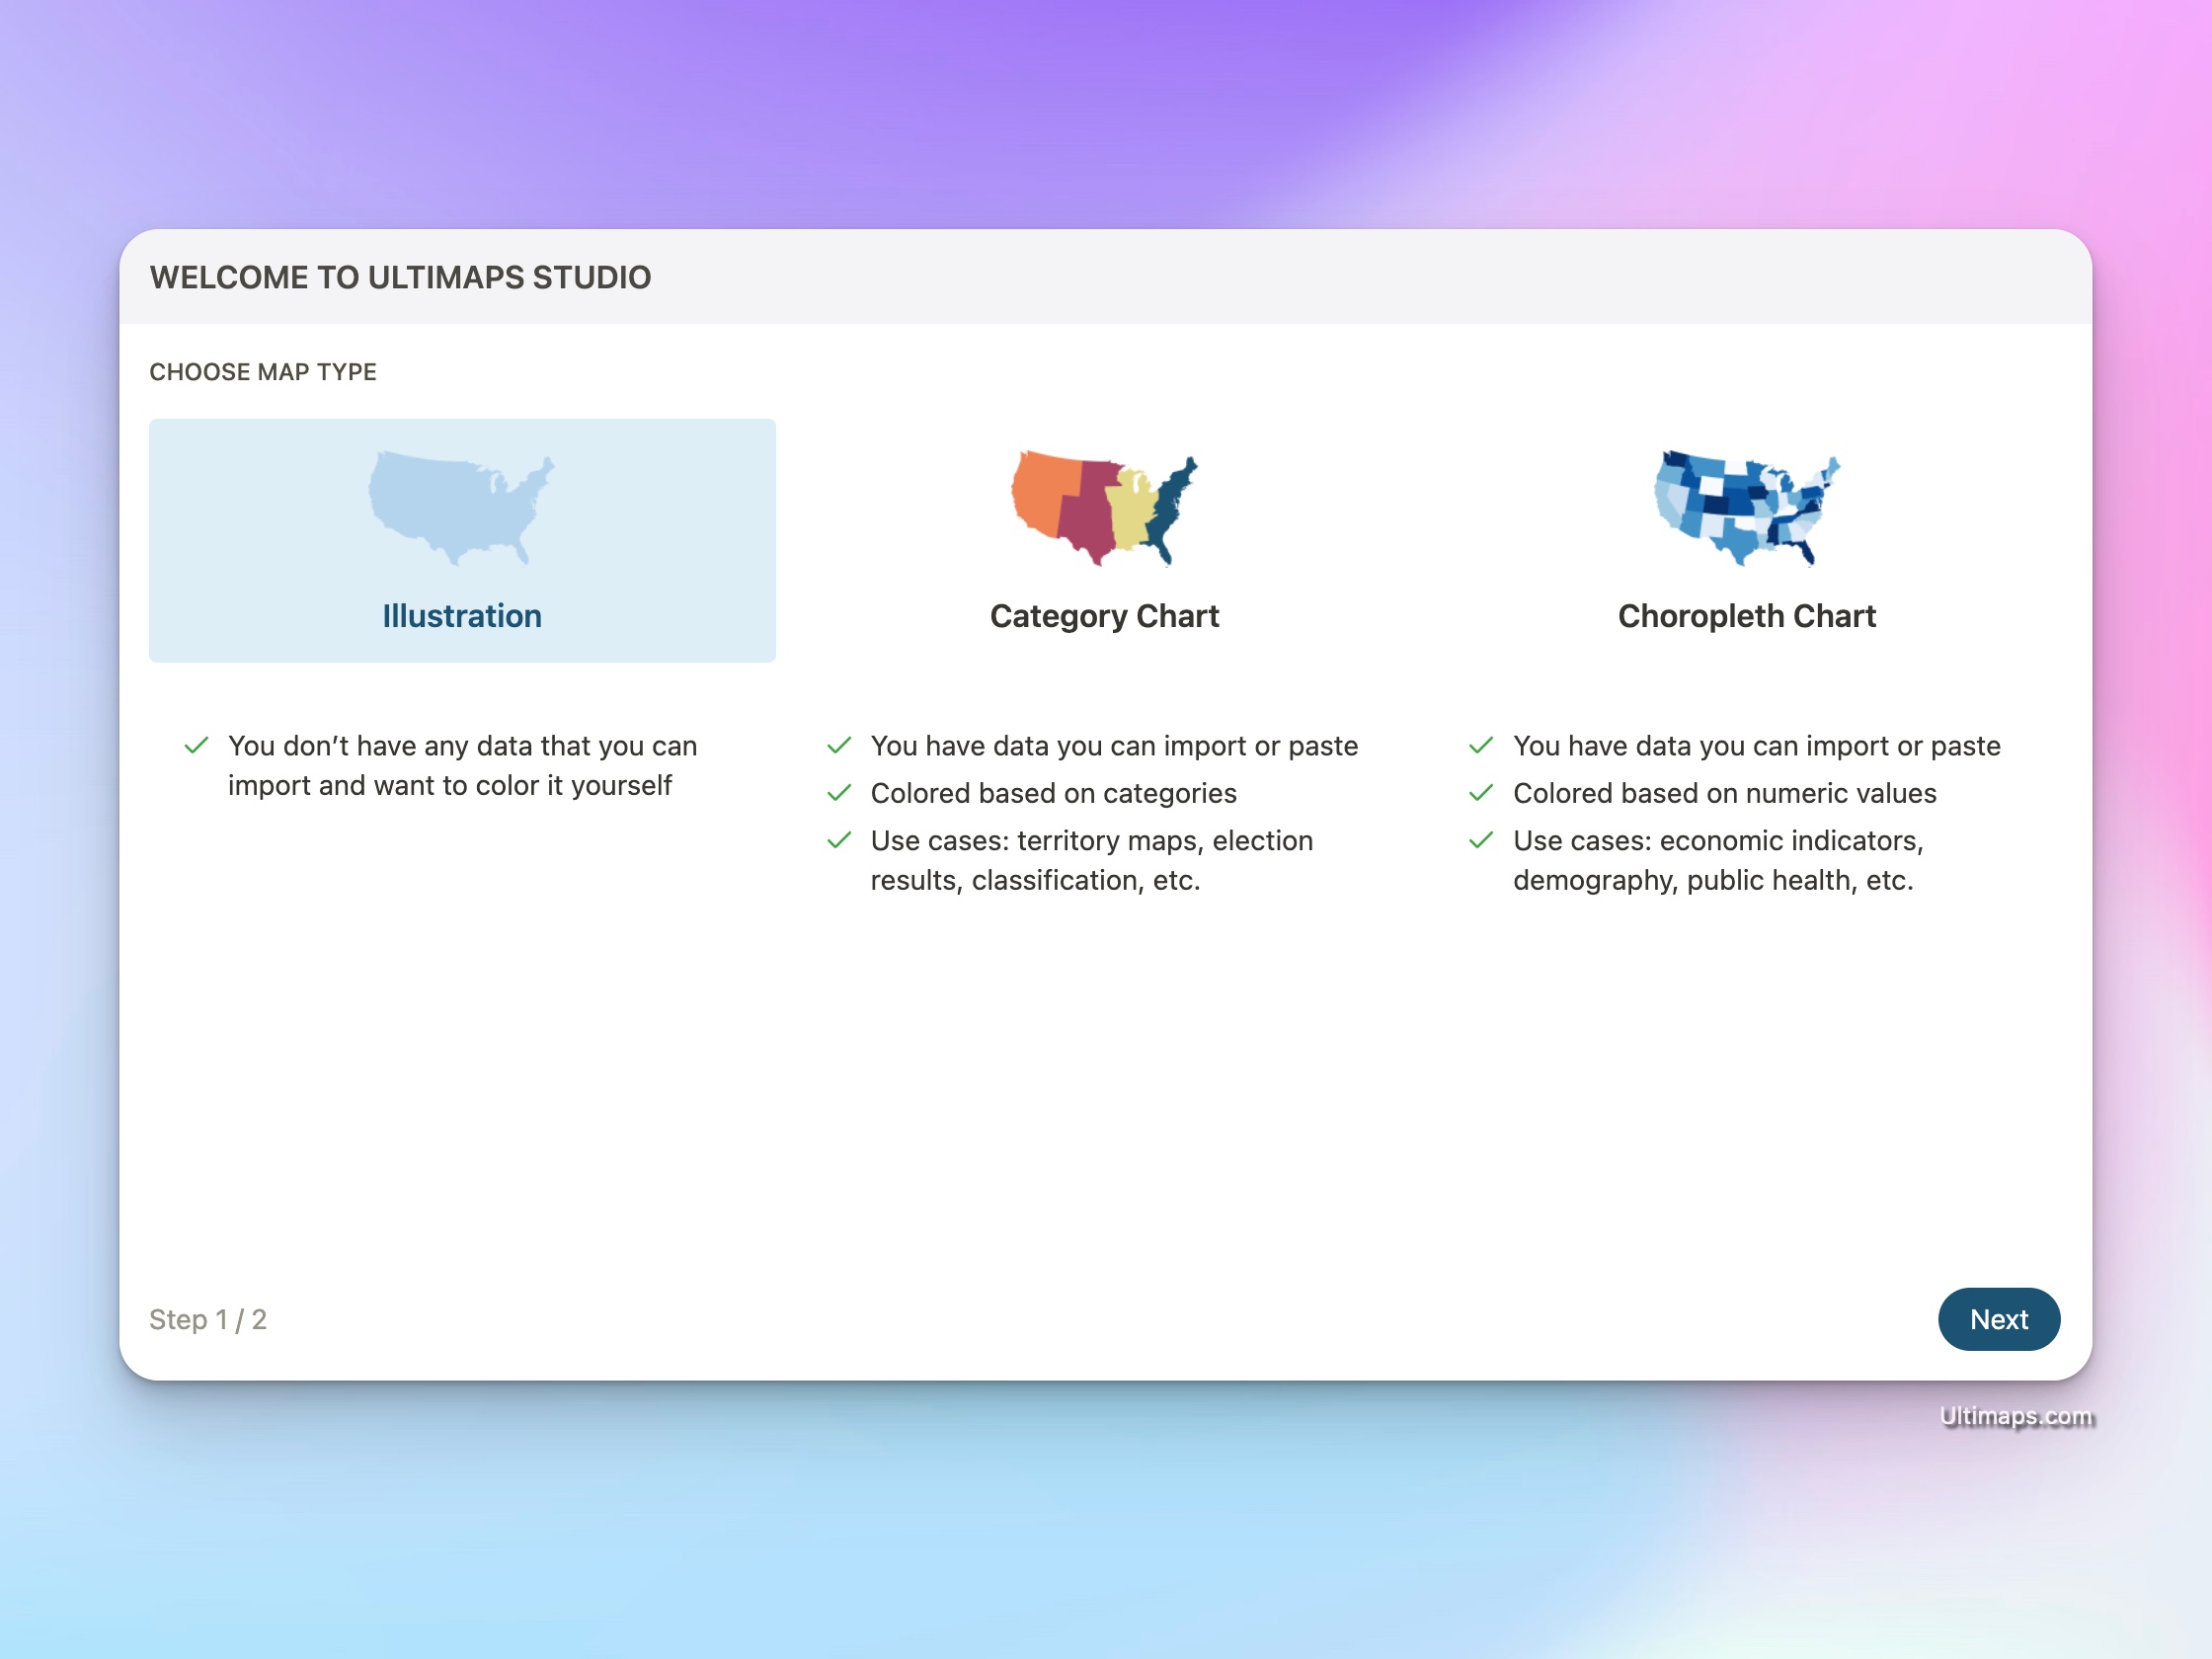
Select "Use this Template" to create a new map. On the Wizard screen, choose "Illustration Map" and then click "Finish Setup".
Working with the Ultimaps Studio
Each visualization is created in a separate document, and you can create as many documents as you need. The document title is displayed at the top of the screen and can be edited by clicking on it. We strongly recommend signing up for an account to save your work and share your maps via a link. Once you've logged in, your progress will be automatically saved.
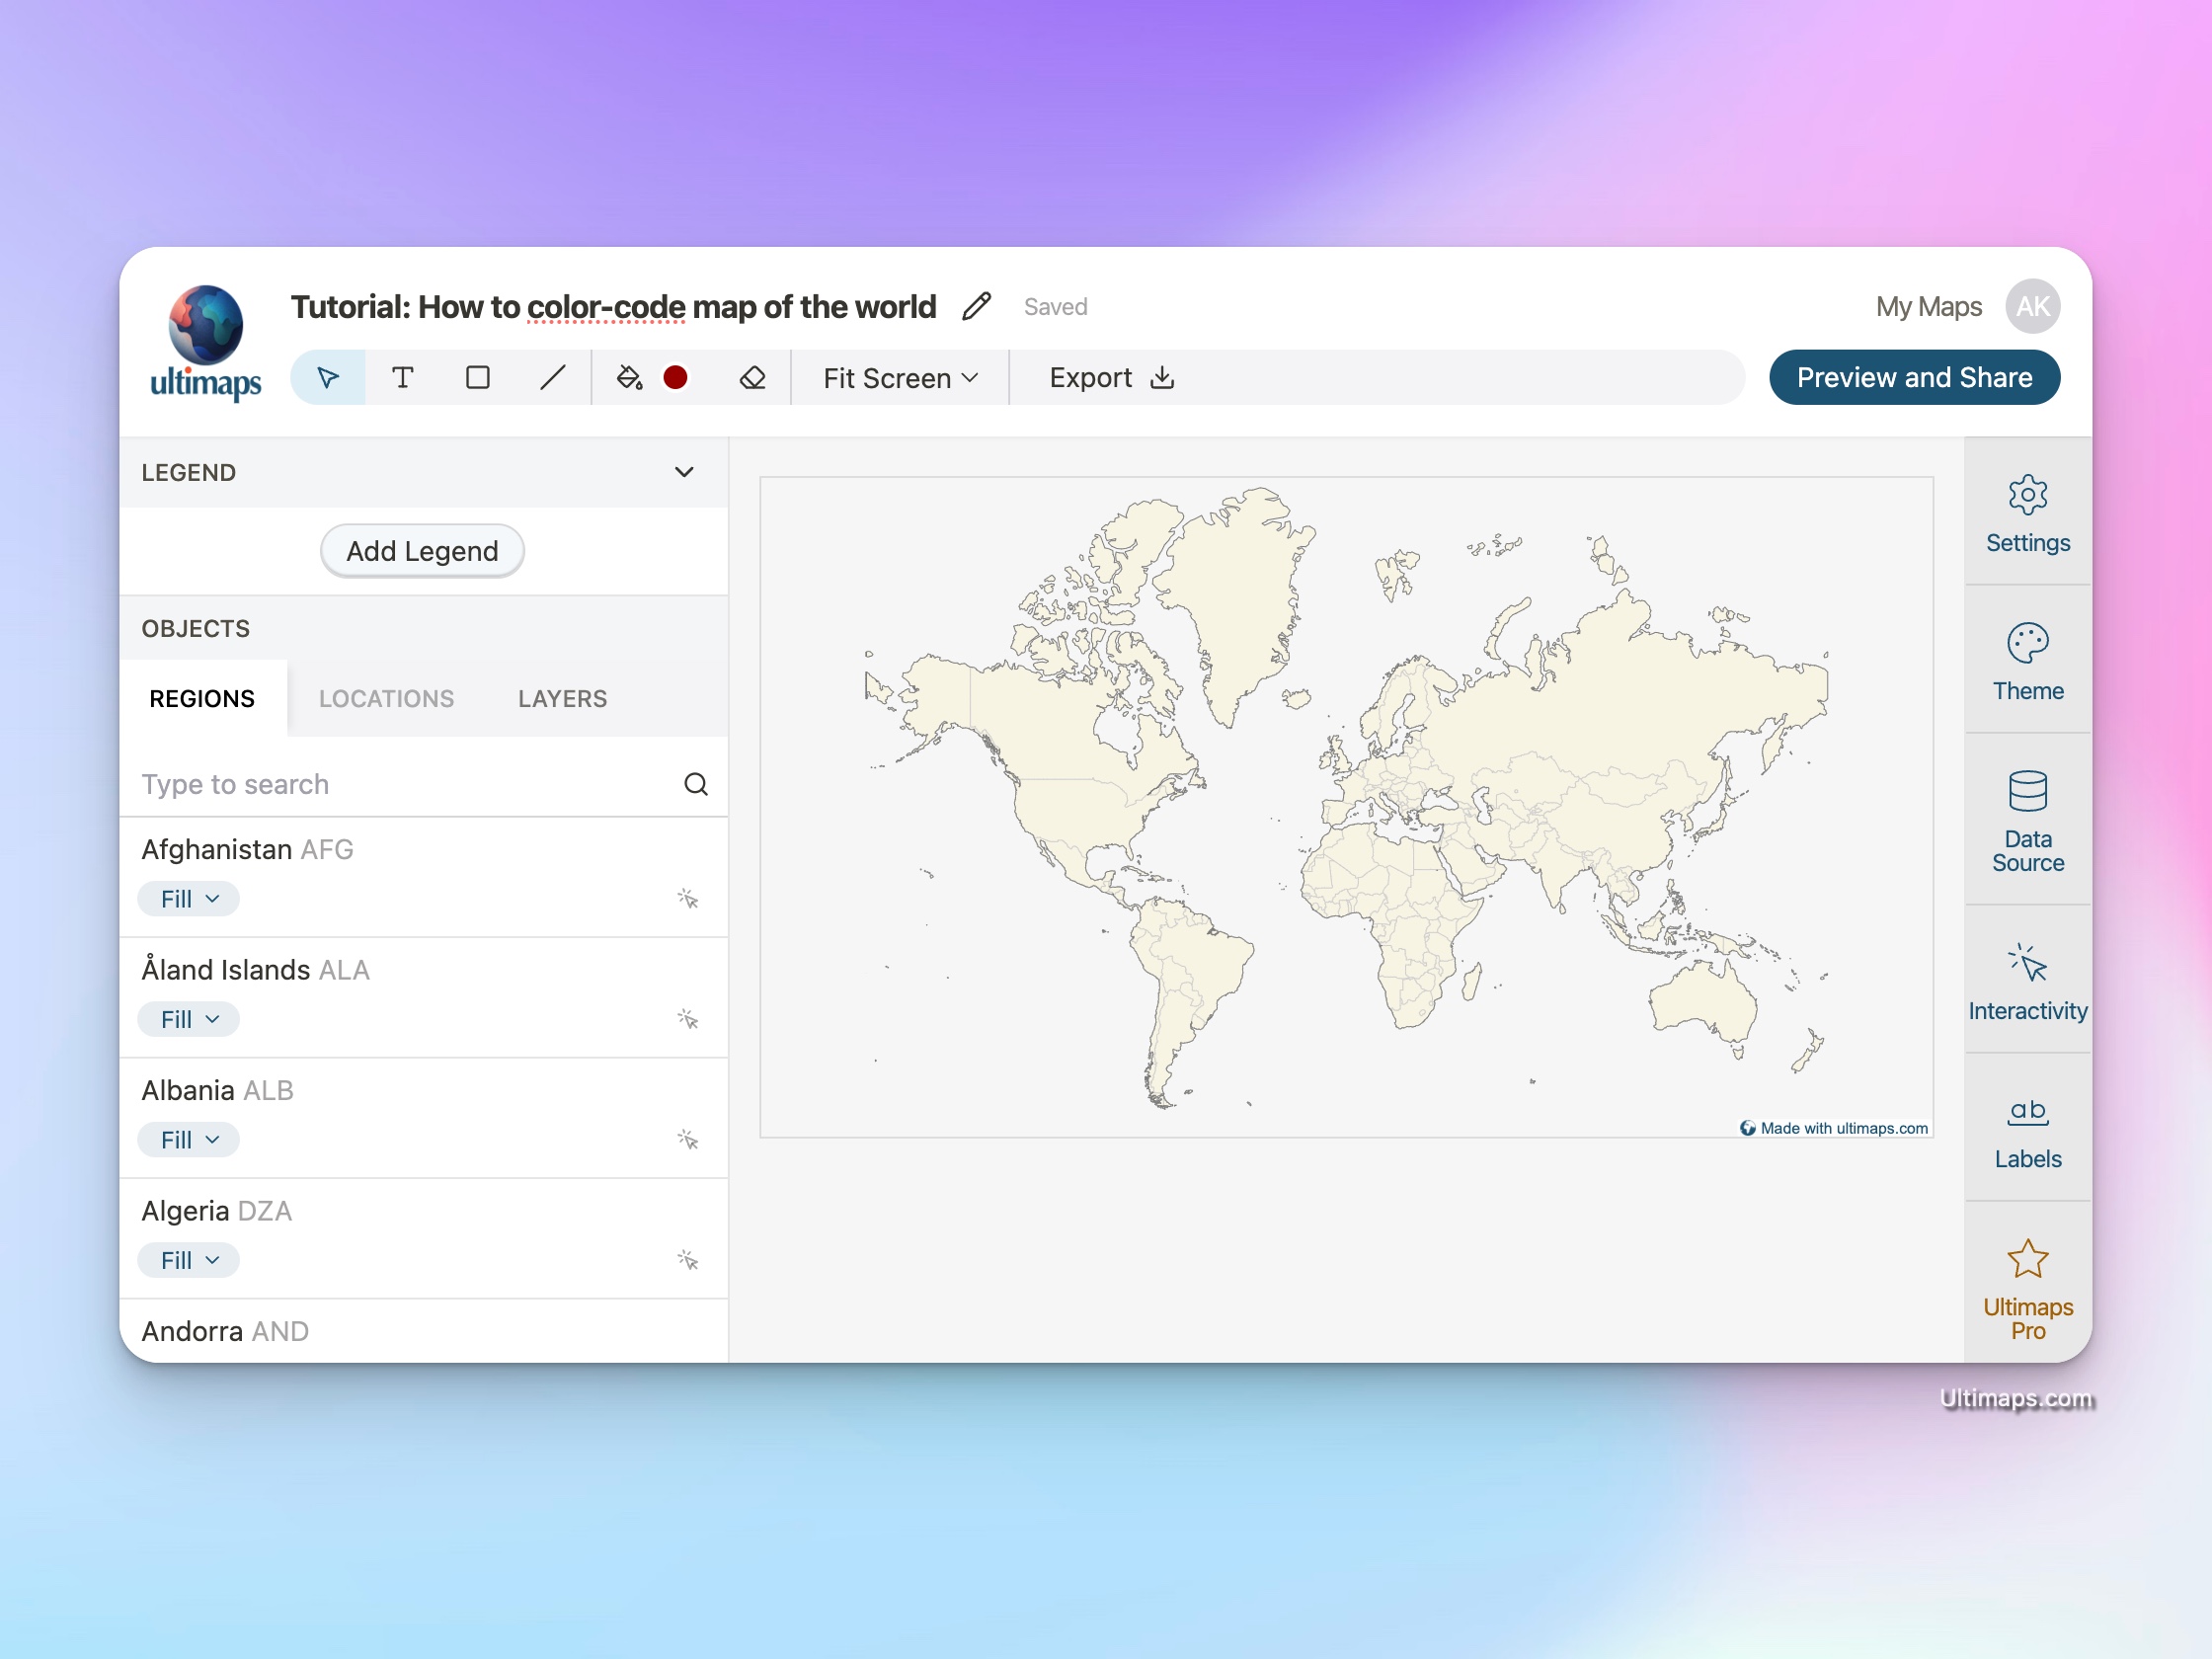
When working with a map, you'll see the "Regions" panel on the left. This panel contains all regions (countries in this case) present on the map.
At the top of the screen, you'll find a toolbar with various drawing tools, such as rectangles, lines, and text. Additionally, there's a "Bucket Fill" tool that allows you to quickly fill a country with a color.
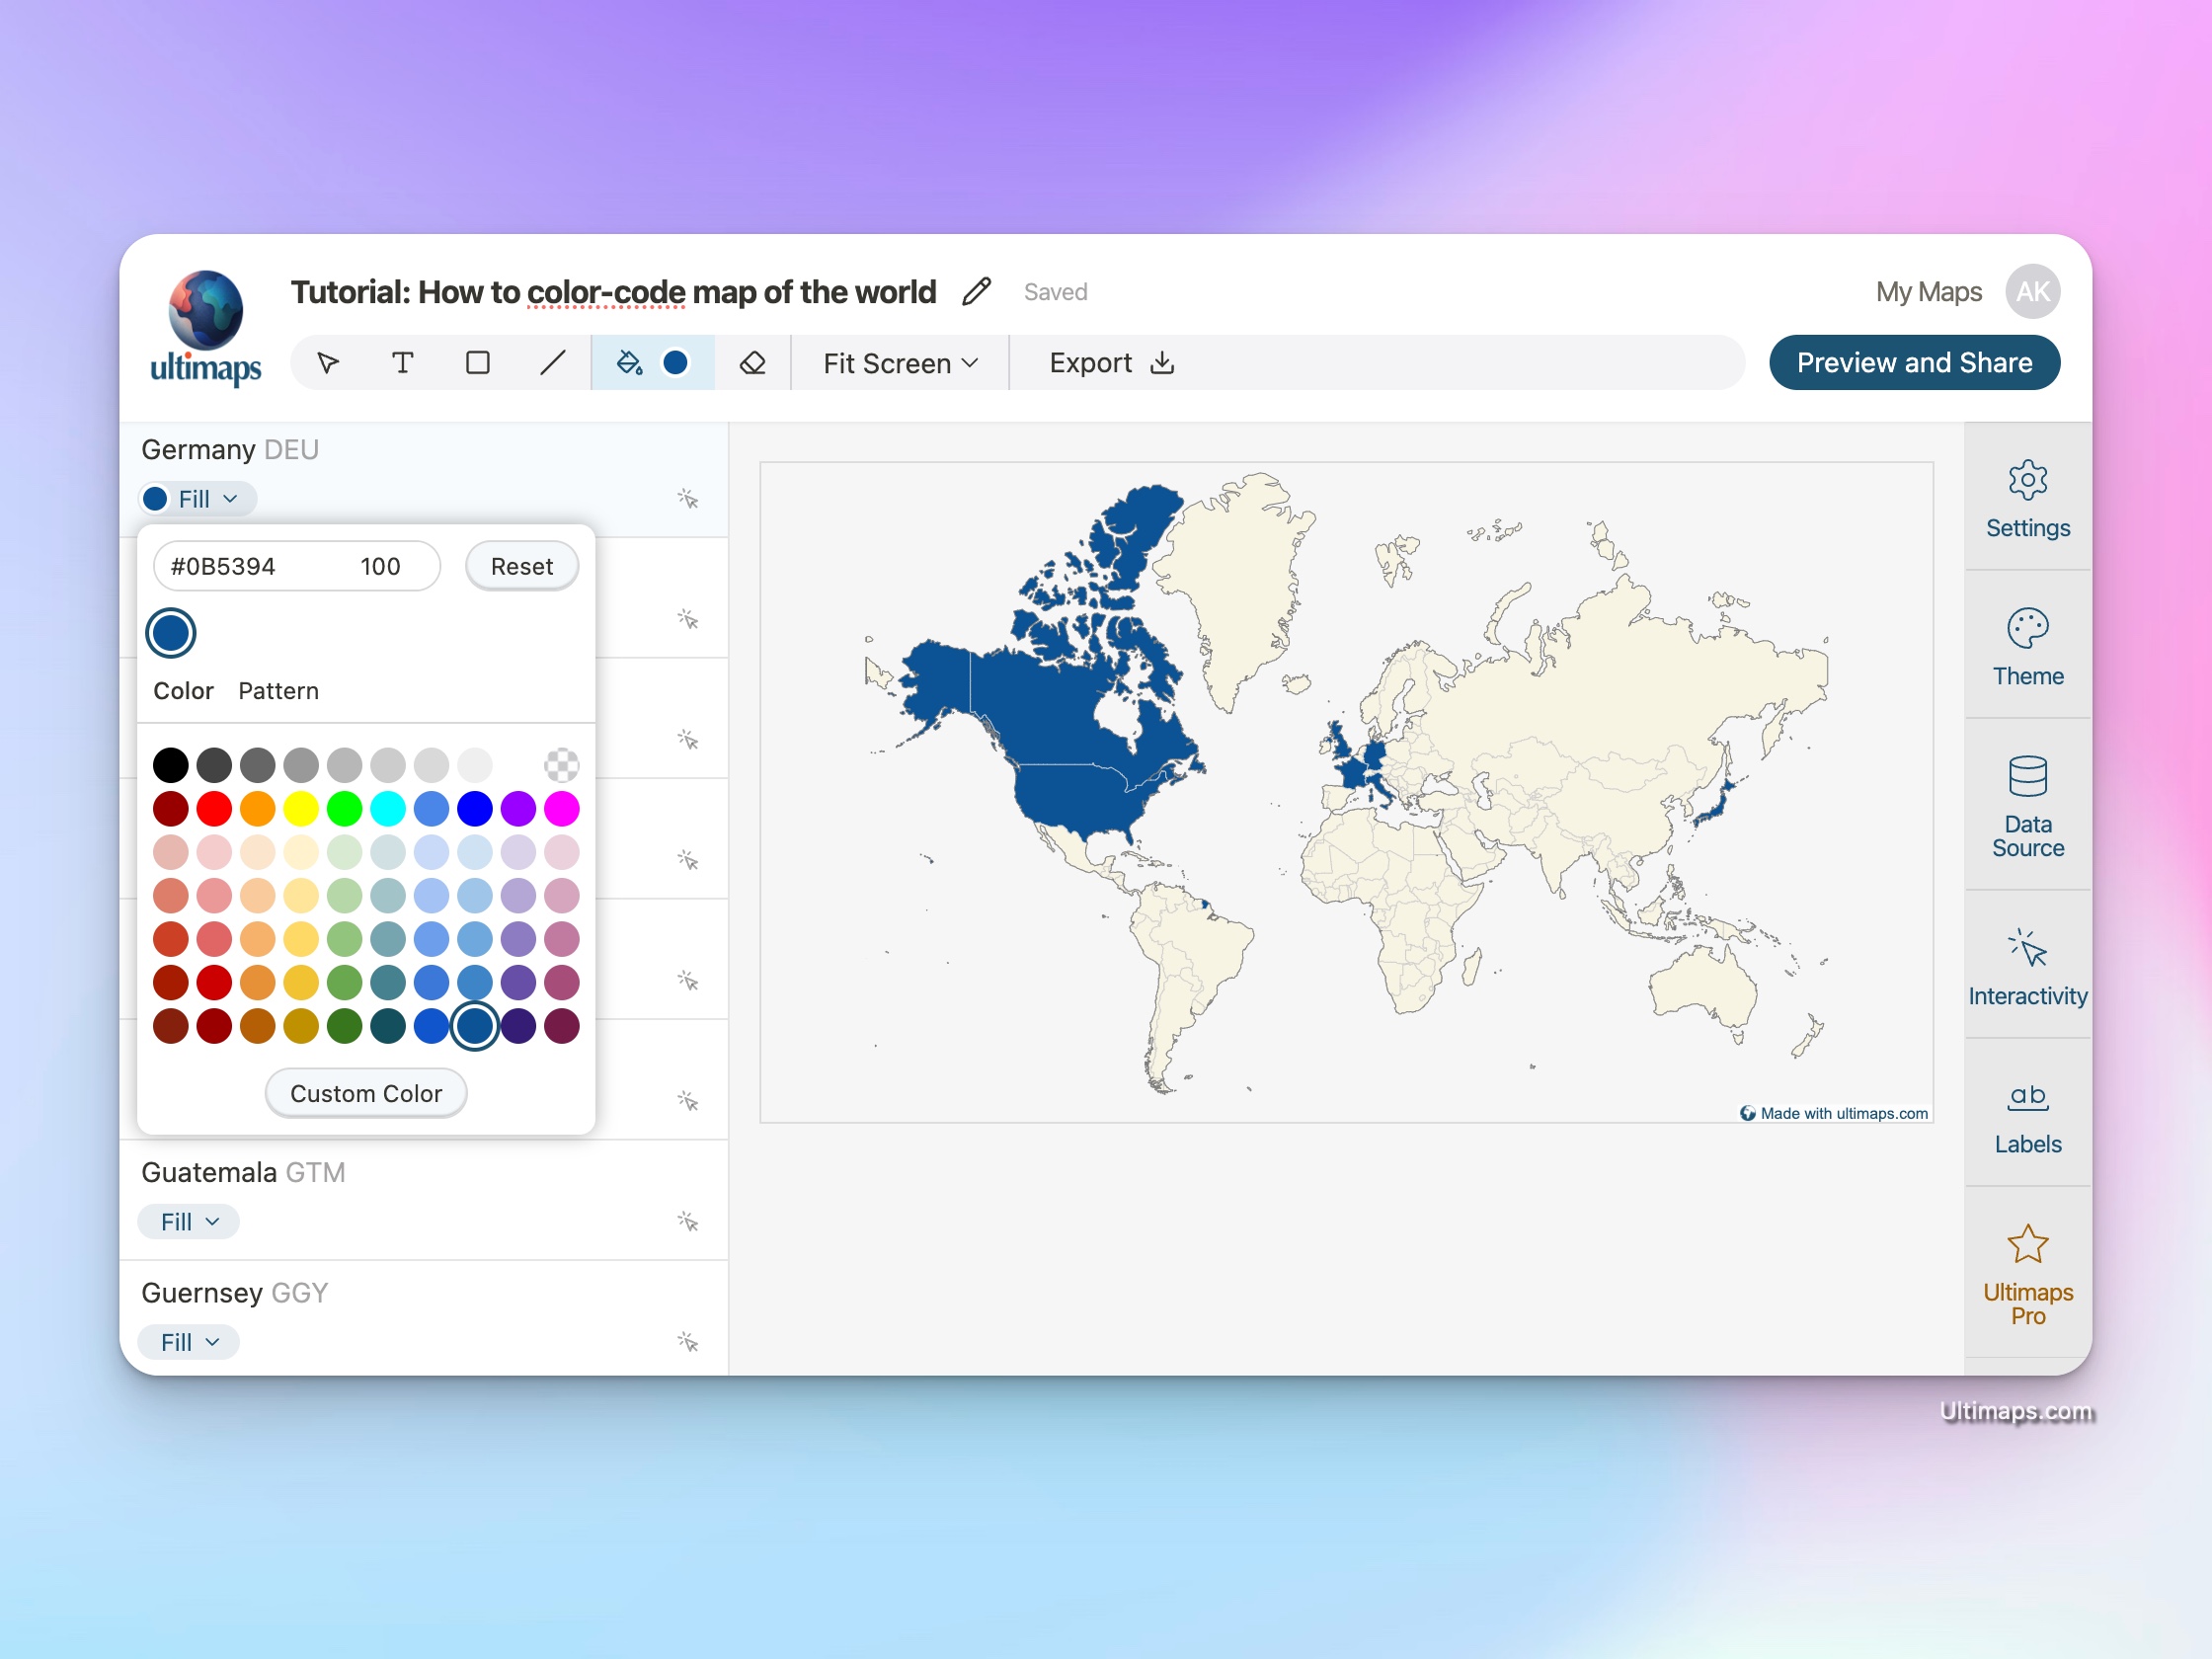
Coloring the Map
There are two approaches to coloring the Illustration map:
- In the "Regions" panel, find a country you wish to color and choose its style by clicking on the "Fill" button.
- Activate the "Bucket Fill" tool in the toolbar and click on the country you want to color. There's also a "Eraser" tool that is useful when you want to remove the color from a specific country.
For this example, let's color the countries of the United States, Canada, the United Kingdom, France, Germany, Italy, and Japan.
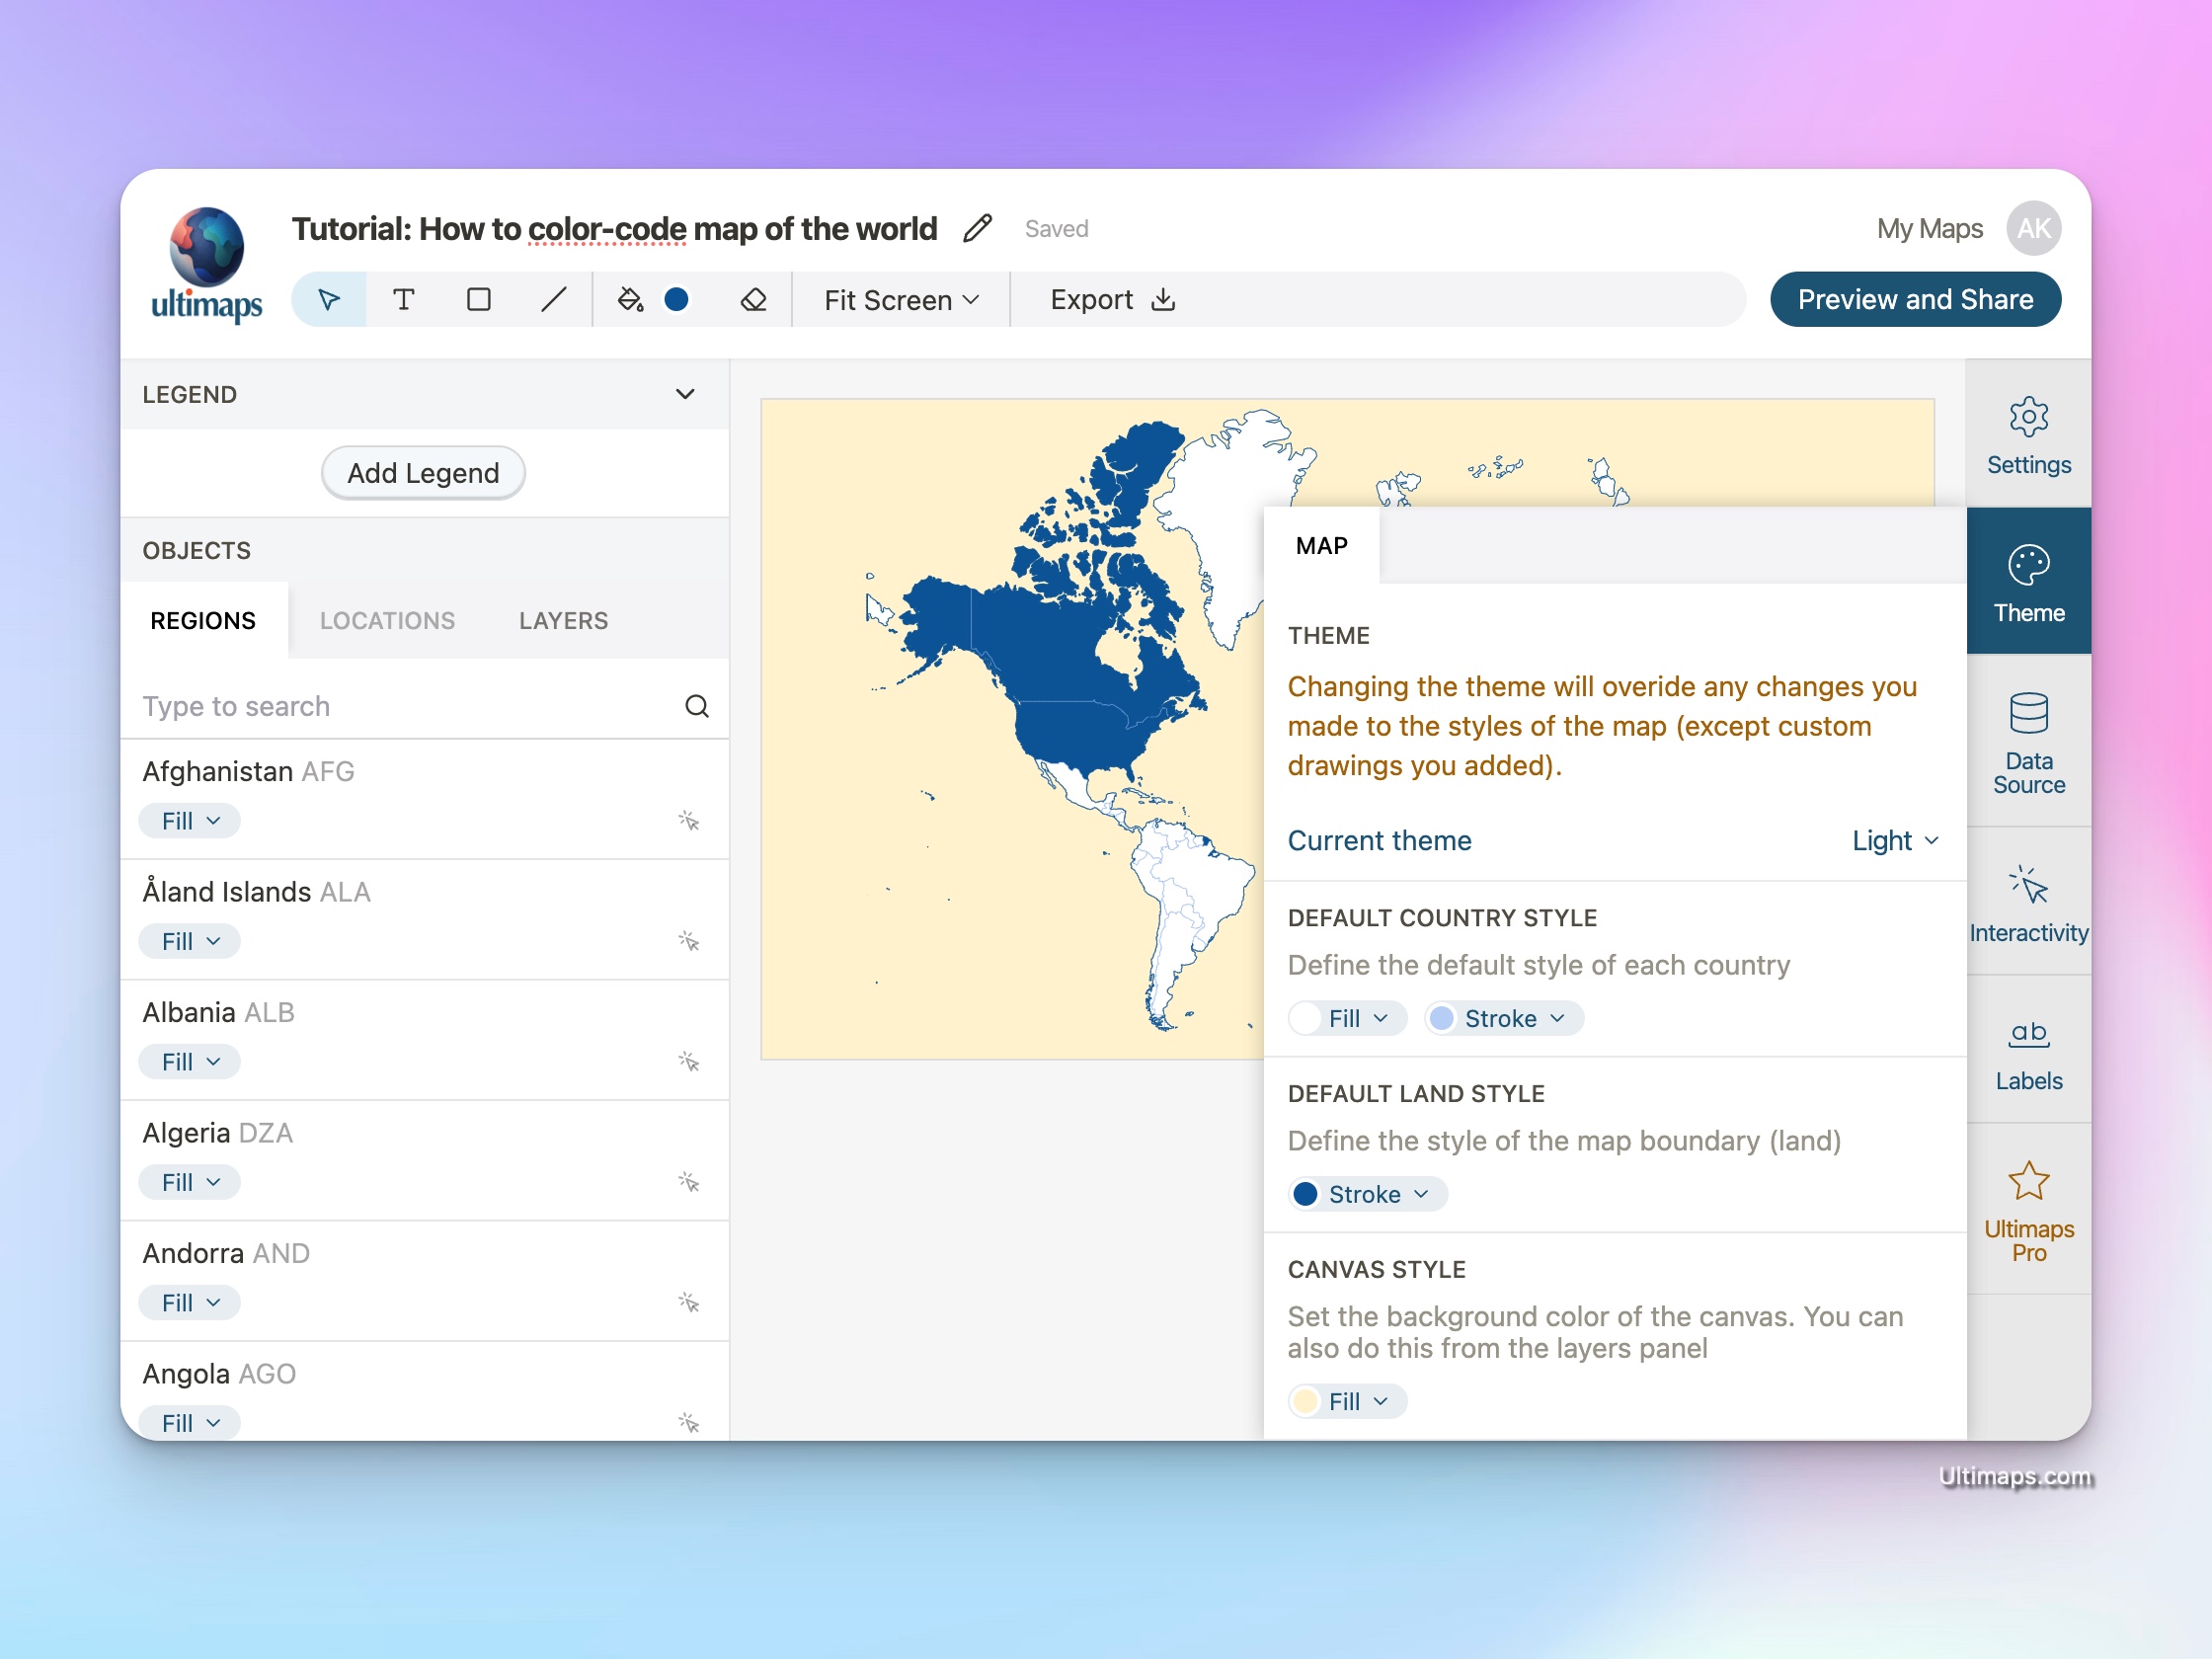
Additional Customizations
To modify the default appearance of countries, navigate to the Theme panel on the right. Here, you can adjust the fill color and border style for all countries. It's important to note that the default fill will only be applied to countries you haven't manually colored. In our example, changing the default fill would affect all countries except the United States, Canada, the United Kingdom, France, Germany, Italy, and Japan.
In the image below, I've changed the boundary colors to dark blue, creating a subtle contrast by making the land boundaries slightly brighter than the country boundaries.
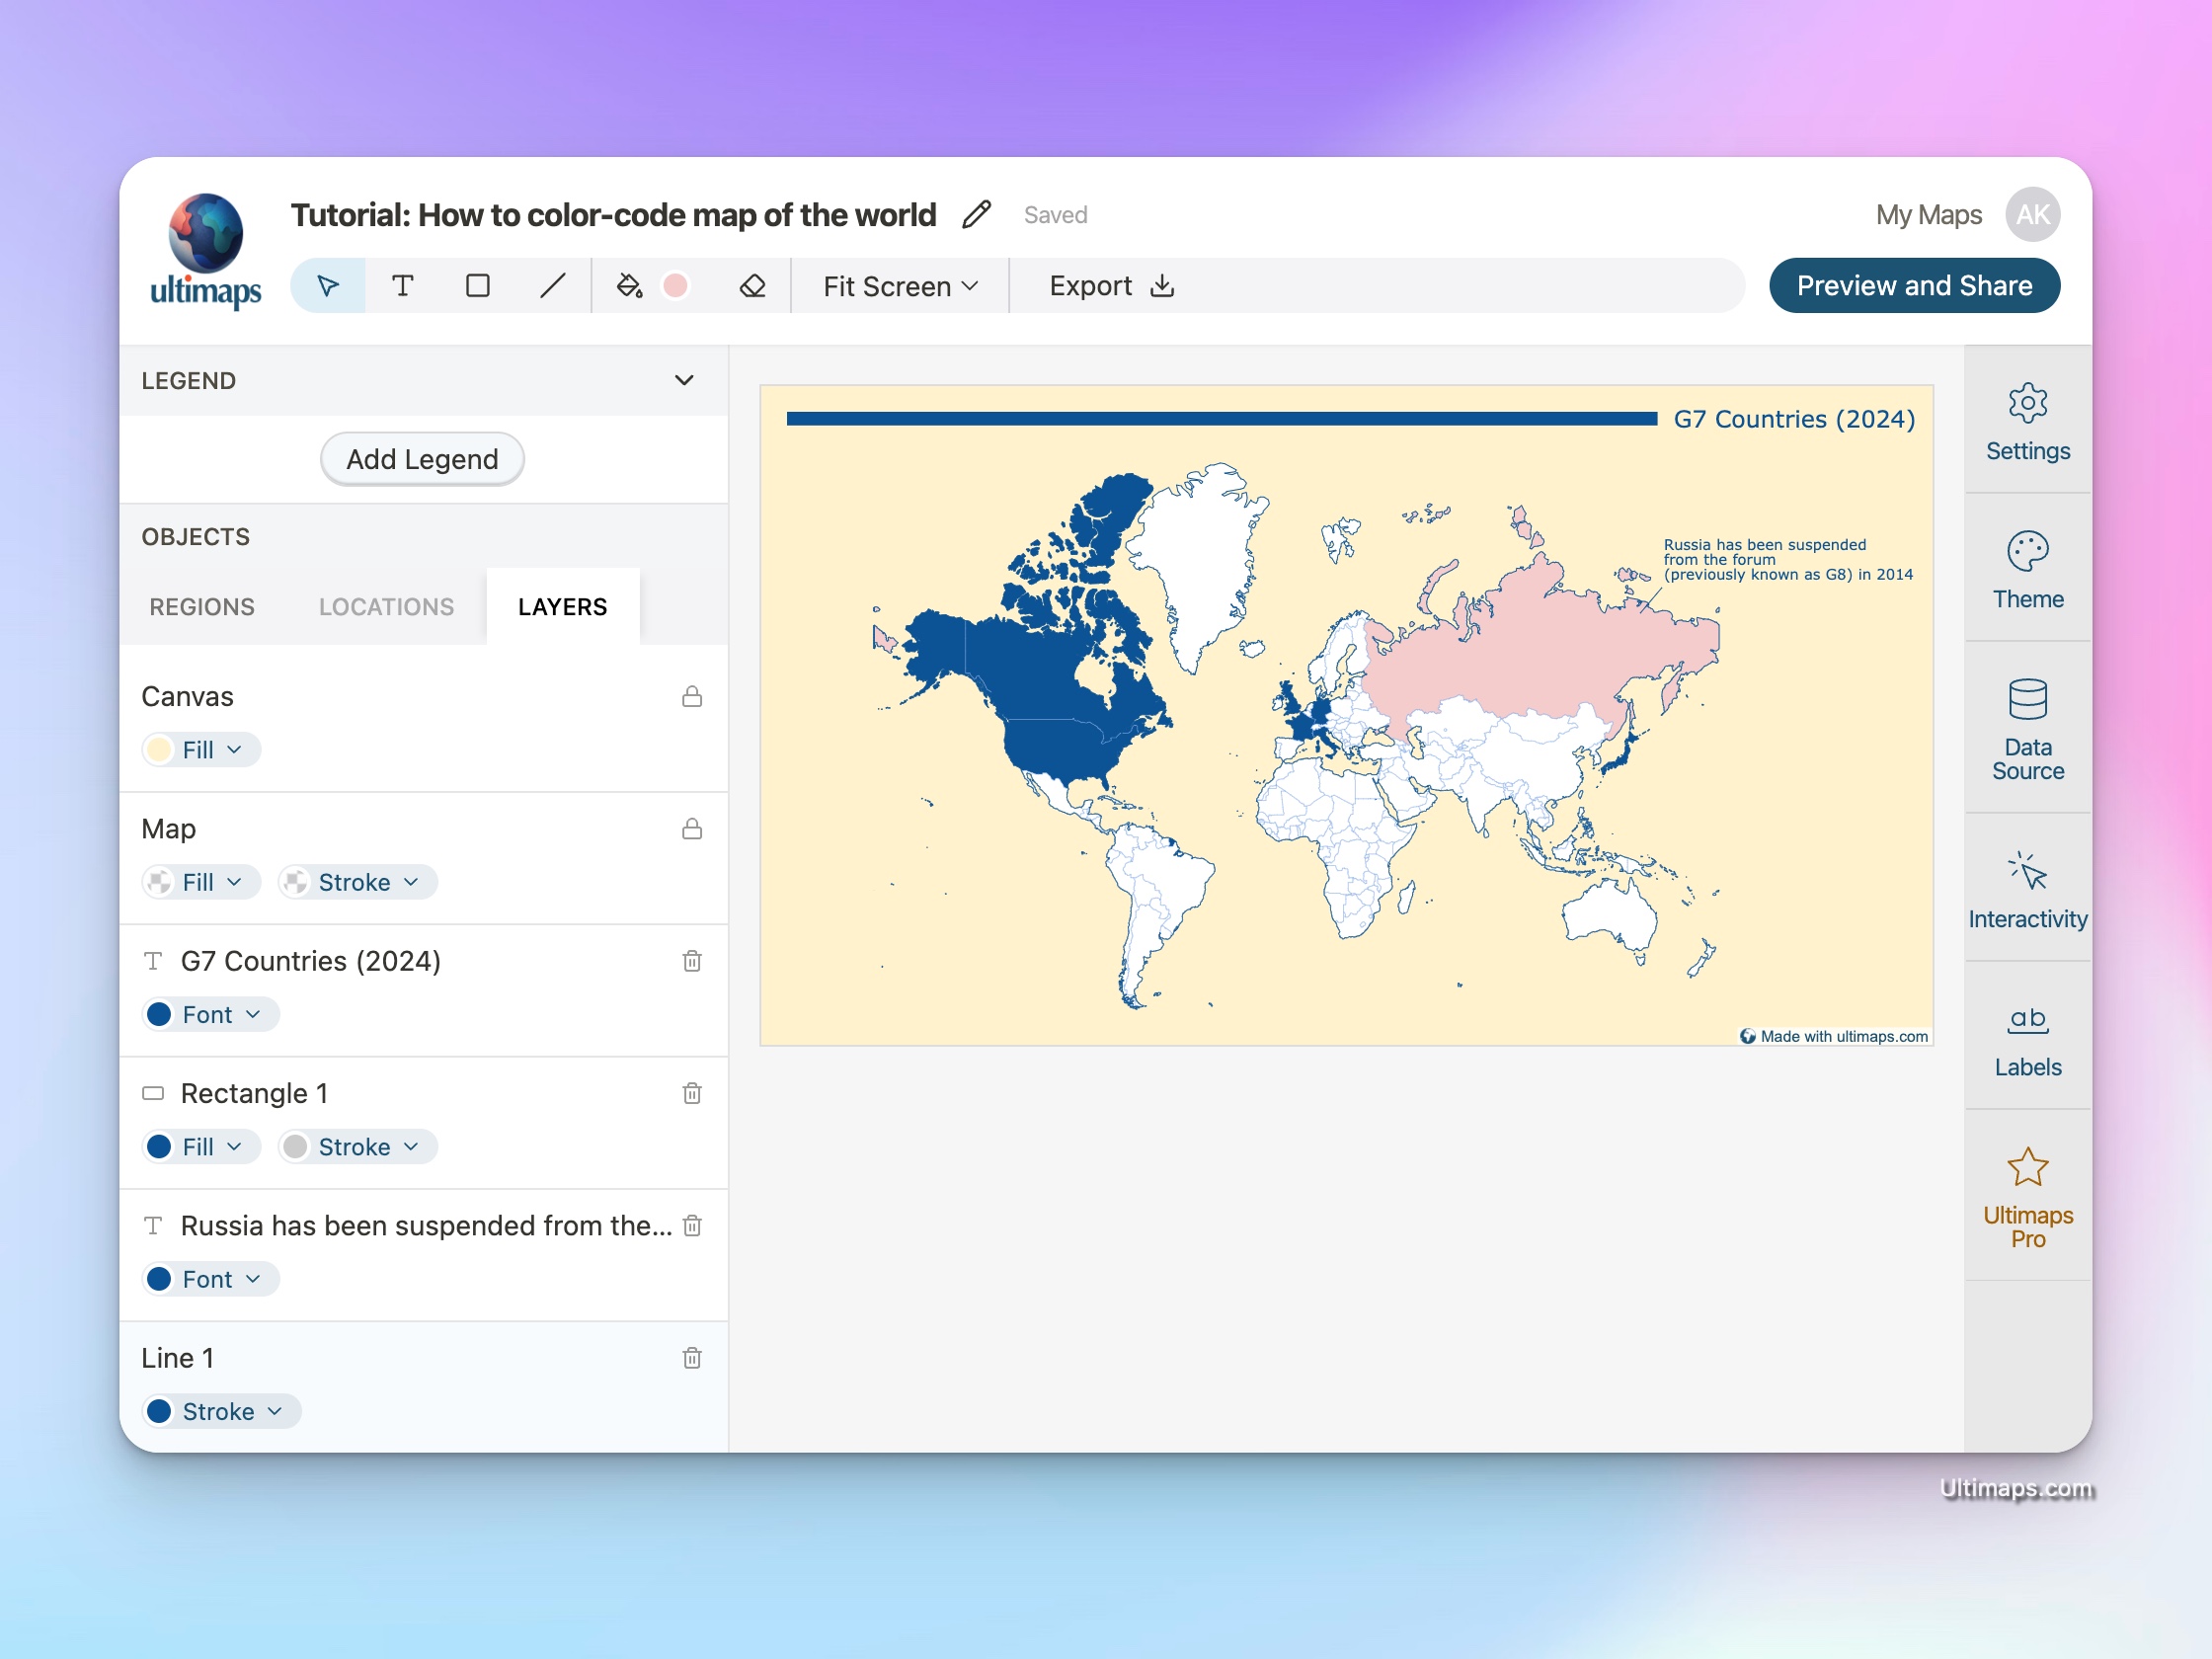
Enhance the Visualization
Use the available tools in the toolbar to enhance your map with rectangles, lines, or text, adding an extra layer of information to your map. These elements, along with the map layer itself, can be moved, resized, and styled as needed to suit your specific requirements.
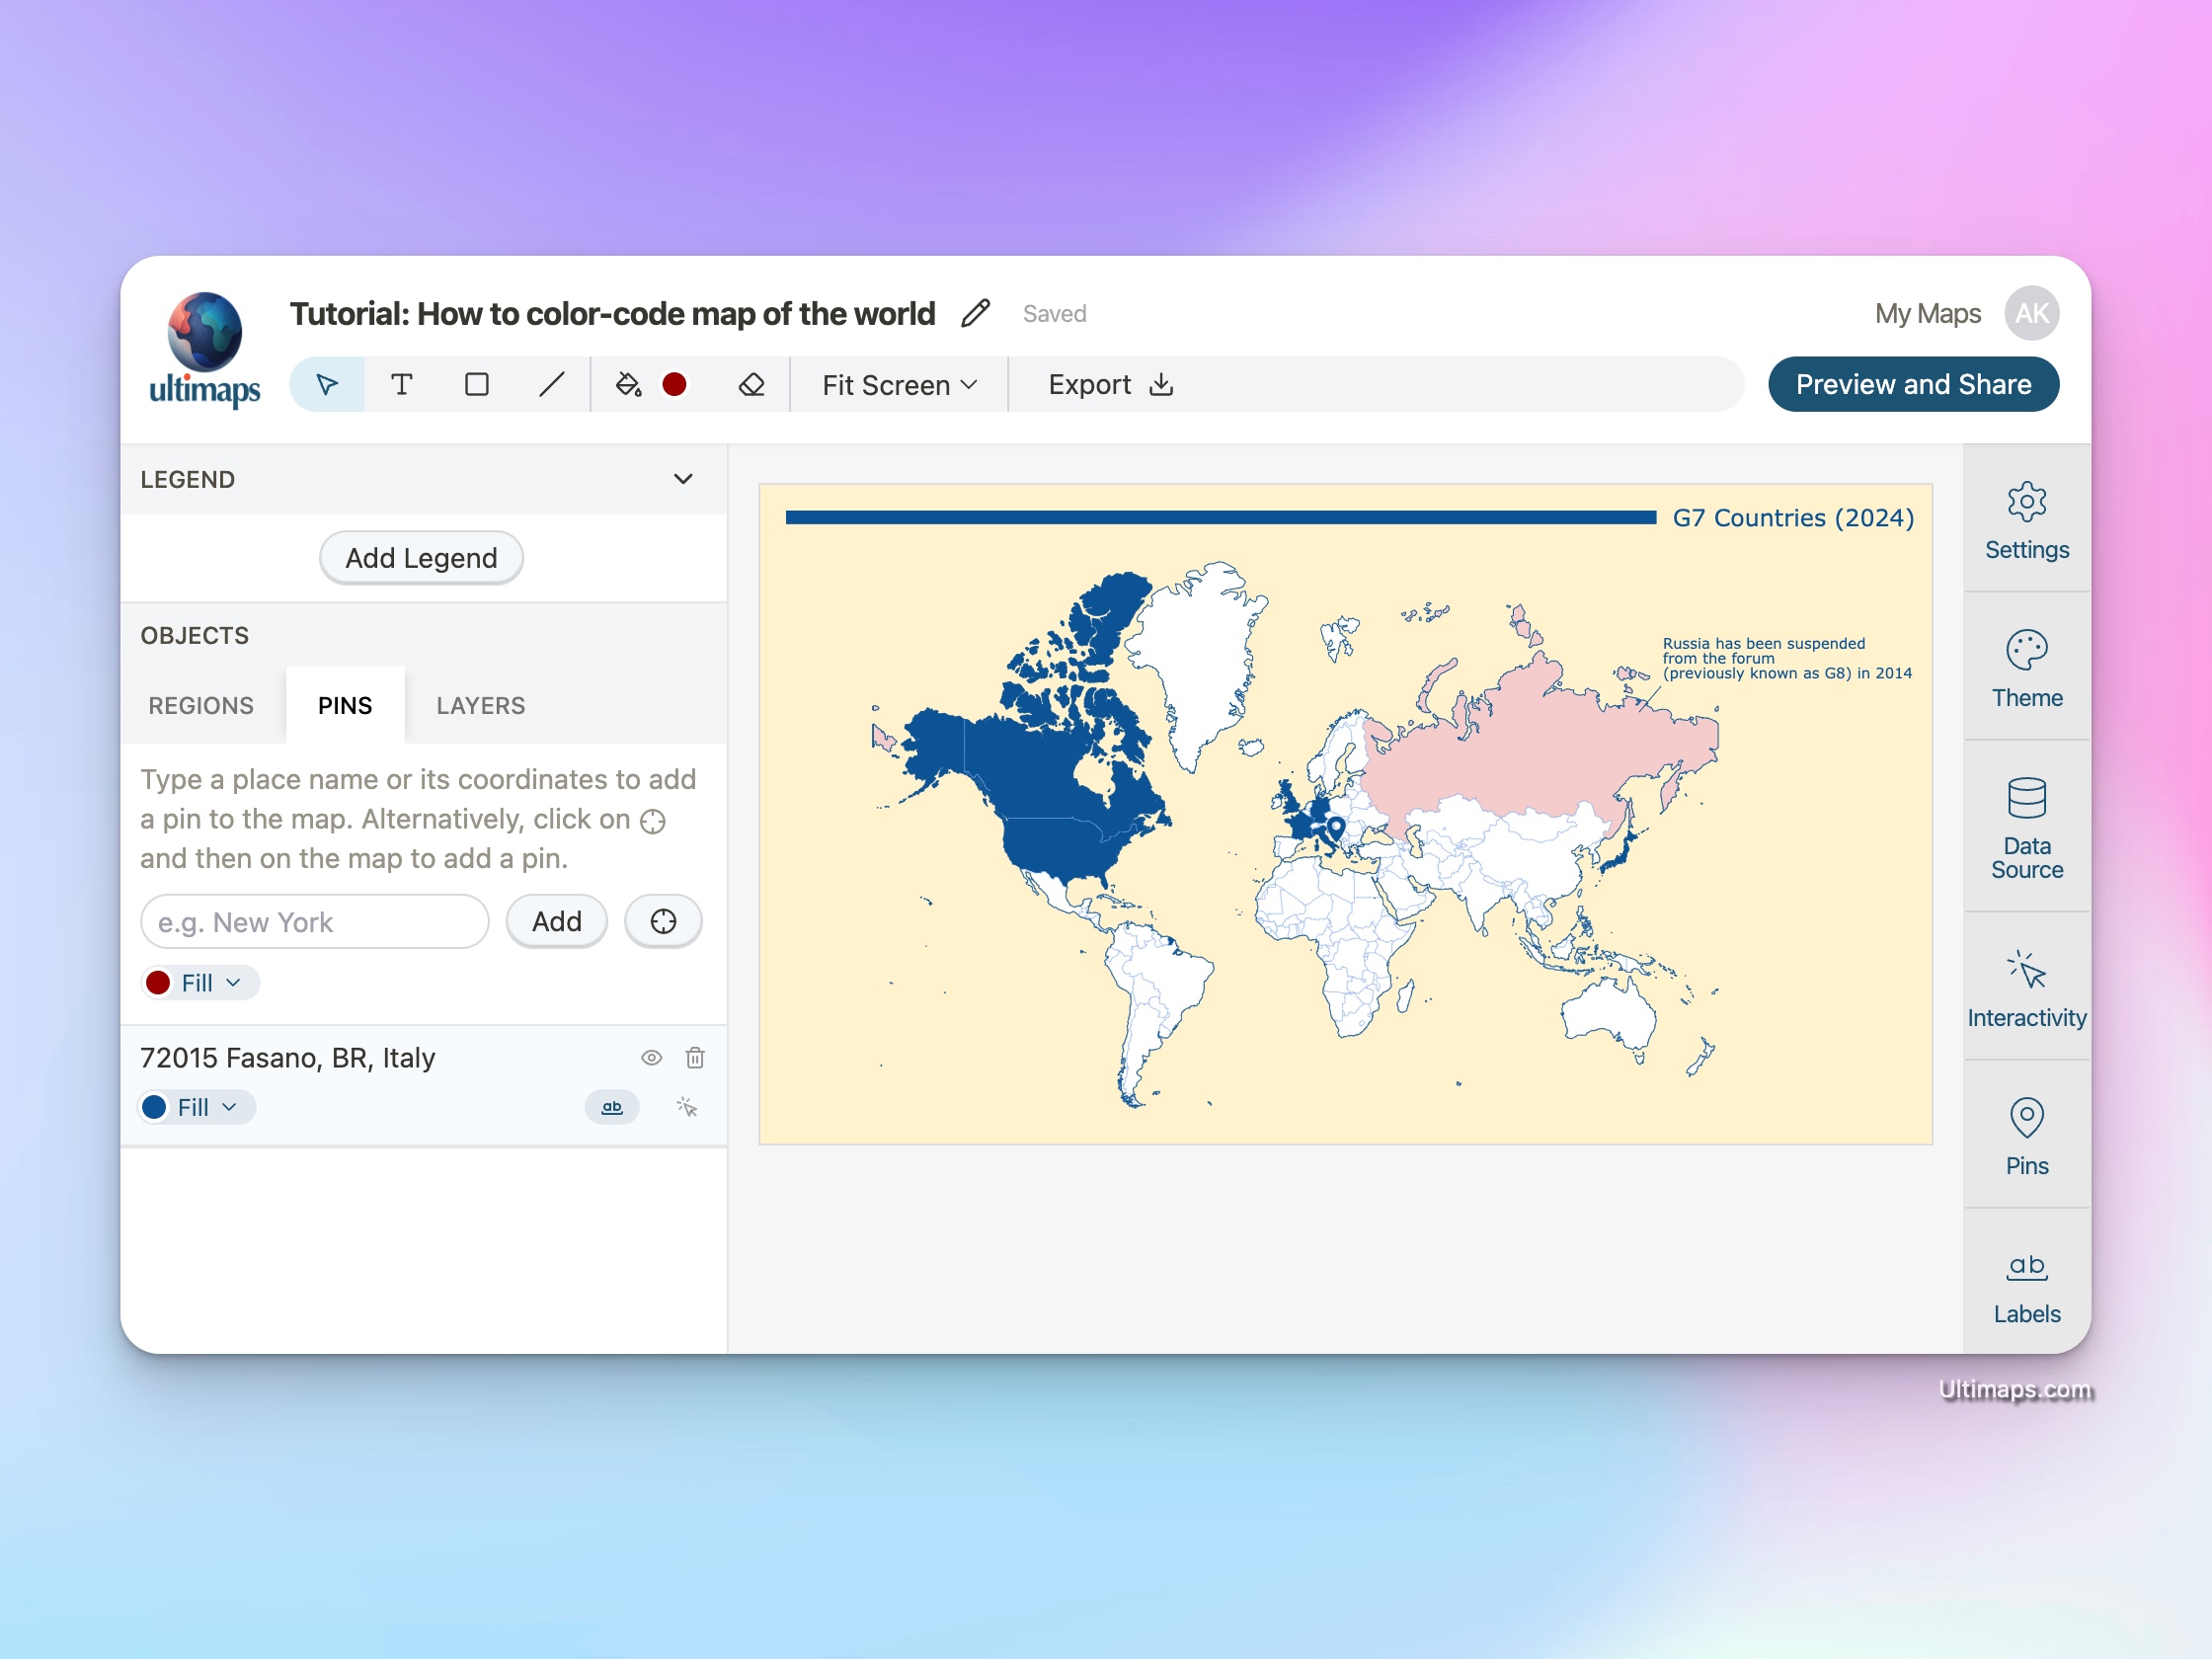
Adding pins to the map
Apart from coloring countries, you can also add pins to the map. Pins are useful when you want to add specific points of interest to your map. For example, you might want to add pins to the locations of headquarters of companies or other organizations or to highlight the location of a specific event.
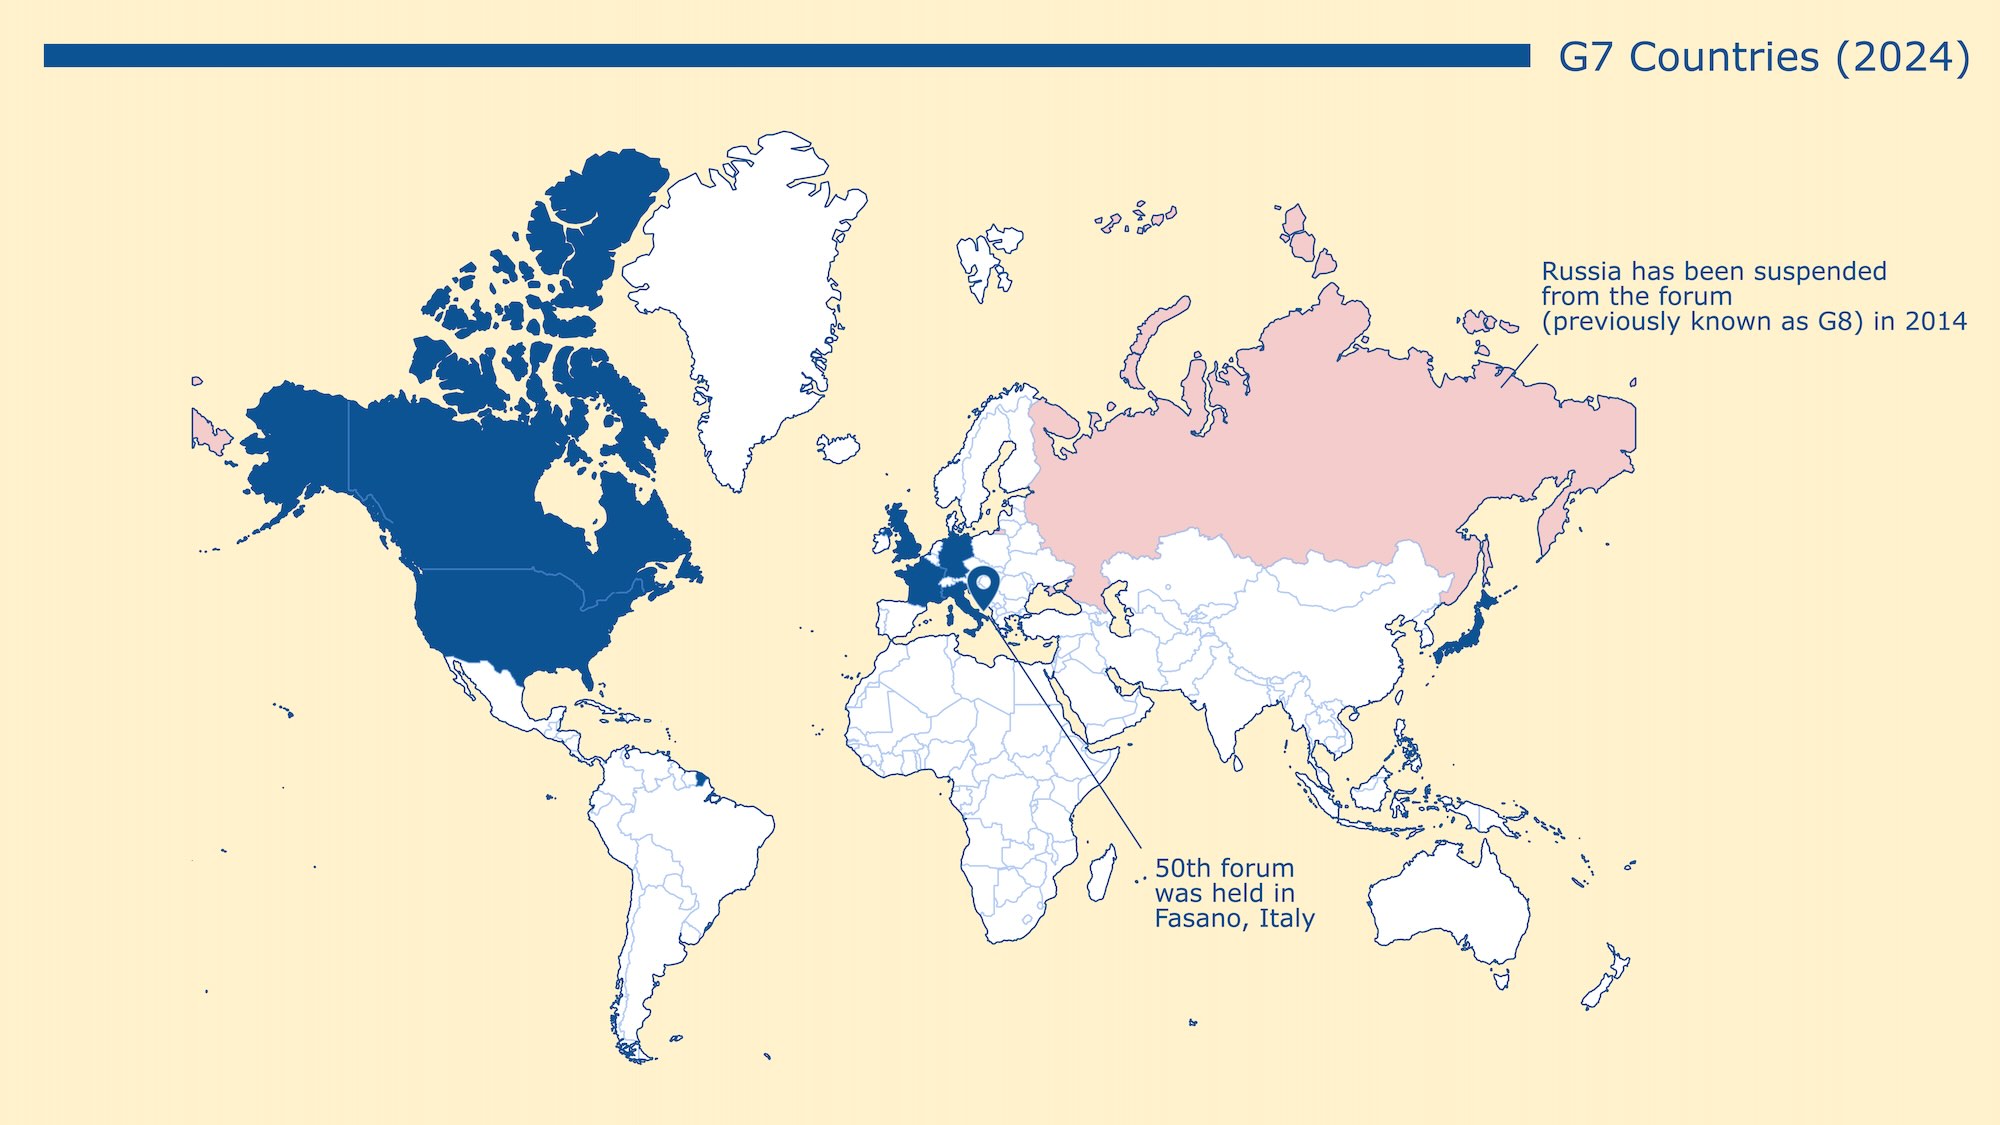
For our example, let's add a pin to the location of the 50th G7 summit which took place in June 2024 in Fasano, Italy.
To add a pin to the map, switch to the "Pins" panel on the left and then type in the name of the location you want to add (in this case "Fasano, Italy") in the search field and click "Add". You should see the pin appear on the map. In order to change the color of the pin, click on the "Fill" button.
Pins can have labels as well. You can add a label to a pin by selecting the pin and then clicking on one of the "Label" buttons, depending on which side of the pin you want the label to appear. Once you've placed the label, you can drag it to move it to a different position.
Exporting the Map
To download your map, click on the "Export" button in the toolbar. You can choose between PNG, SVG and PDF formats.
Sharing your Map with a Link
Alternatively, you can share your map using a link. This option is useful when you want to incorporate interactive elements into your map (a topic we'll explore in a separate tutorial).
To share your map, click on the "Share and Embed" button in the toolbar and hit "Publish". That will give you a shareable link to your map which is now published and visible to everyone.
Conclusion
By following these steps, you can create a personalized color-coded map of the world (and other geographical areas) in Ultimaps Studio. Create your first map by navigating to Ultimaps Studio. No signup required.
Happy mapping!