How to create US map with colored states
In this article, we will walk you through the steps to create a custom colored US map using Ultimaps. We will cover Illustration Maps in this article (Illustration Maps don't require data import, so you can color the states manually).
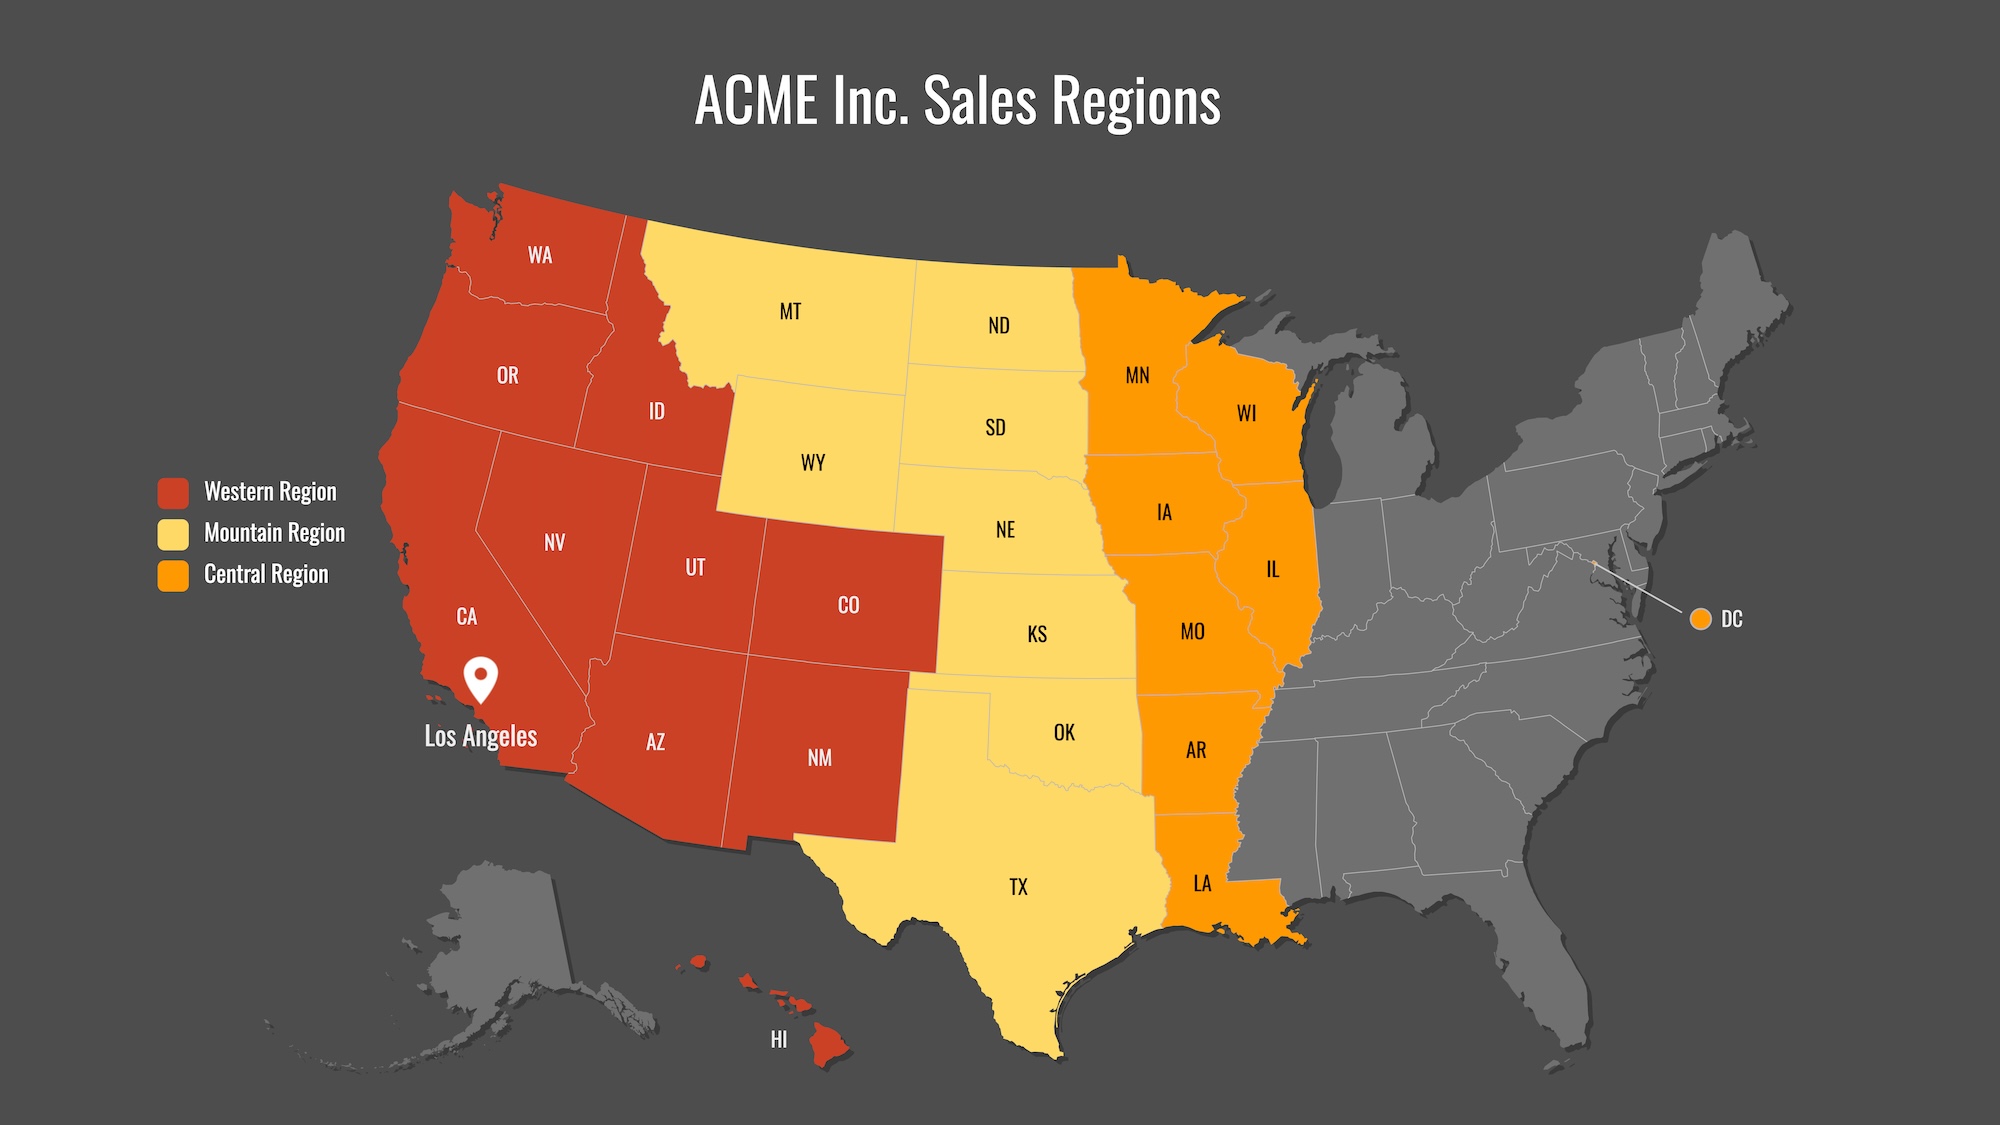
As a result, you'll get a map that can be exported as a PNG, SVG or PDF for use in your presentations and publications, or for printing purposes. Alternatively, you'll be able to share your map by generating a link or embed it on your website.
Ultimaps Studio is a map visualization tool that allows you to create and customize maps and charts right in your browser. Sign-up is not required.
A note on Illustration Maps
There are two approaches to color-coding maps in Ultimaps Studio:
- Importing a dataset (e.g. Excel or CSV file, Google Spreadsheet or Notion Table) and letting the app automatically color the states based on the data.
- Manually choosing the colors for each region (state in our case) you want to highlight.
In this guide, we will walk you through the steps to manually color code states on a map without importing any data.
Creating a Map
Let's begin with creating our new visualization. Navigate to https://studio.ultimaps.com/ and choose the United States option.
There are multiple templates available for the map of the United States, such as the map of the United States counties or the map of the United States with Outlying Territories. Let's choose the United States - States template that contains mainland states + Alaska and Hawaii.
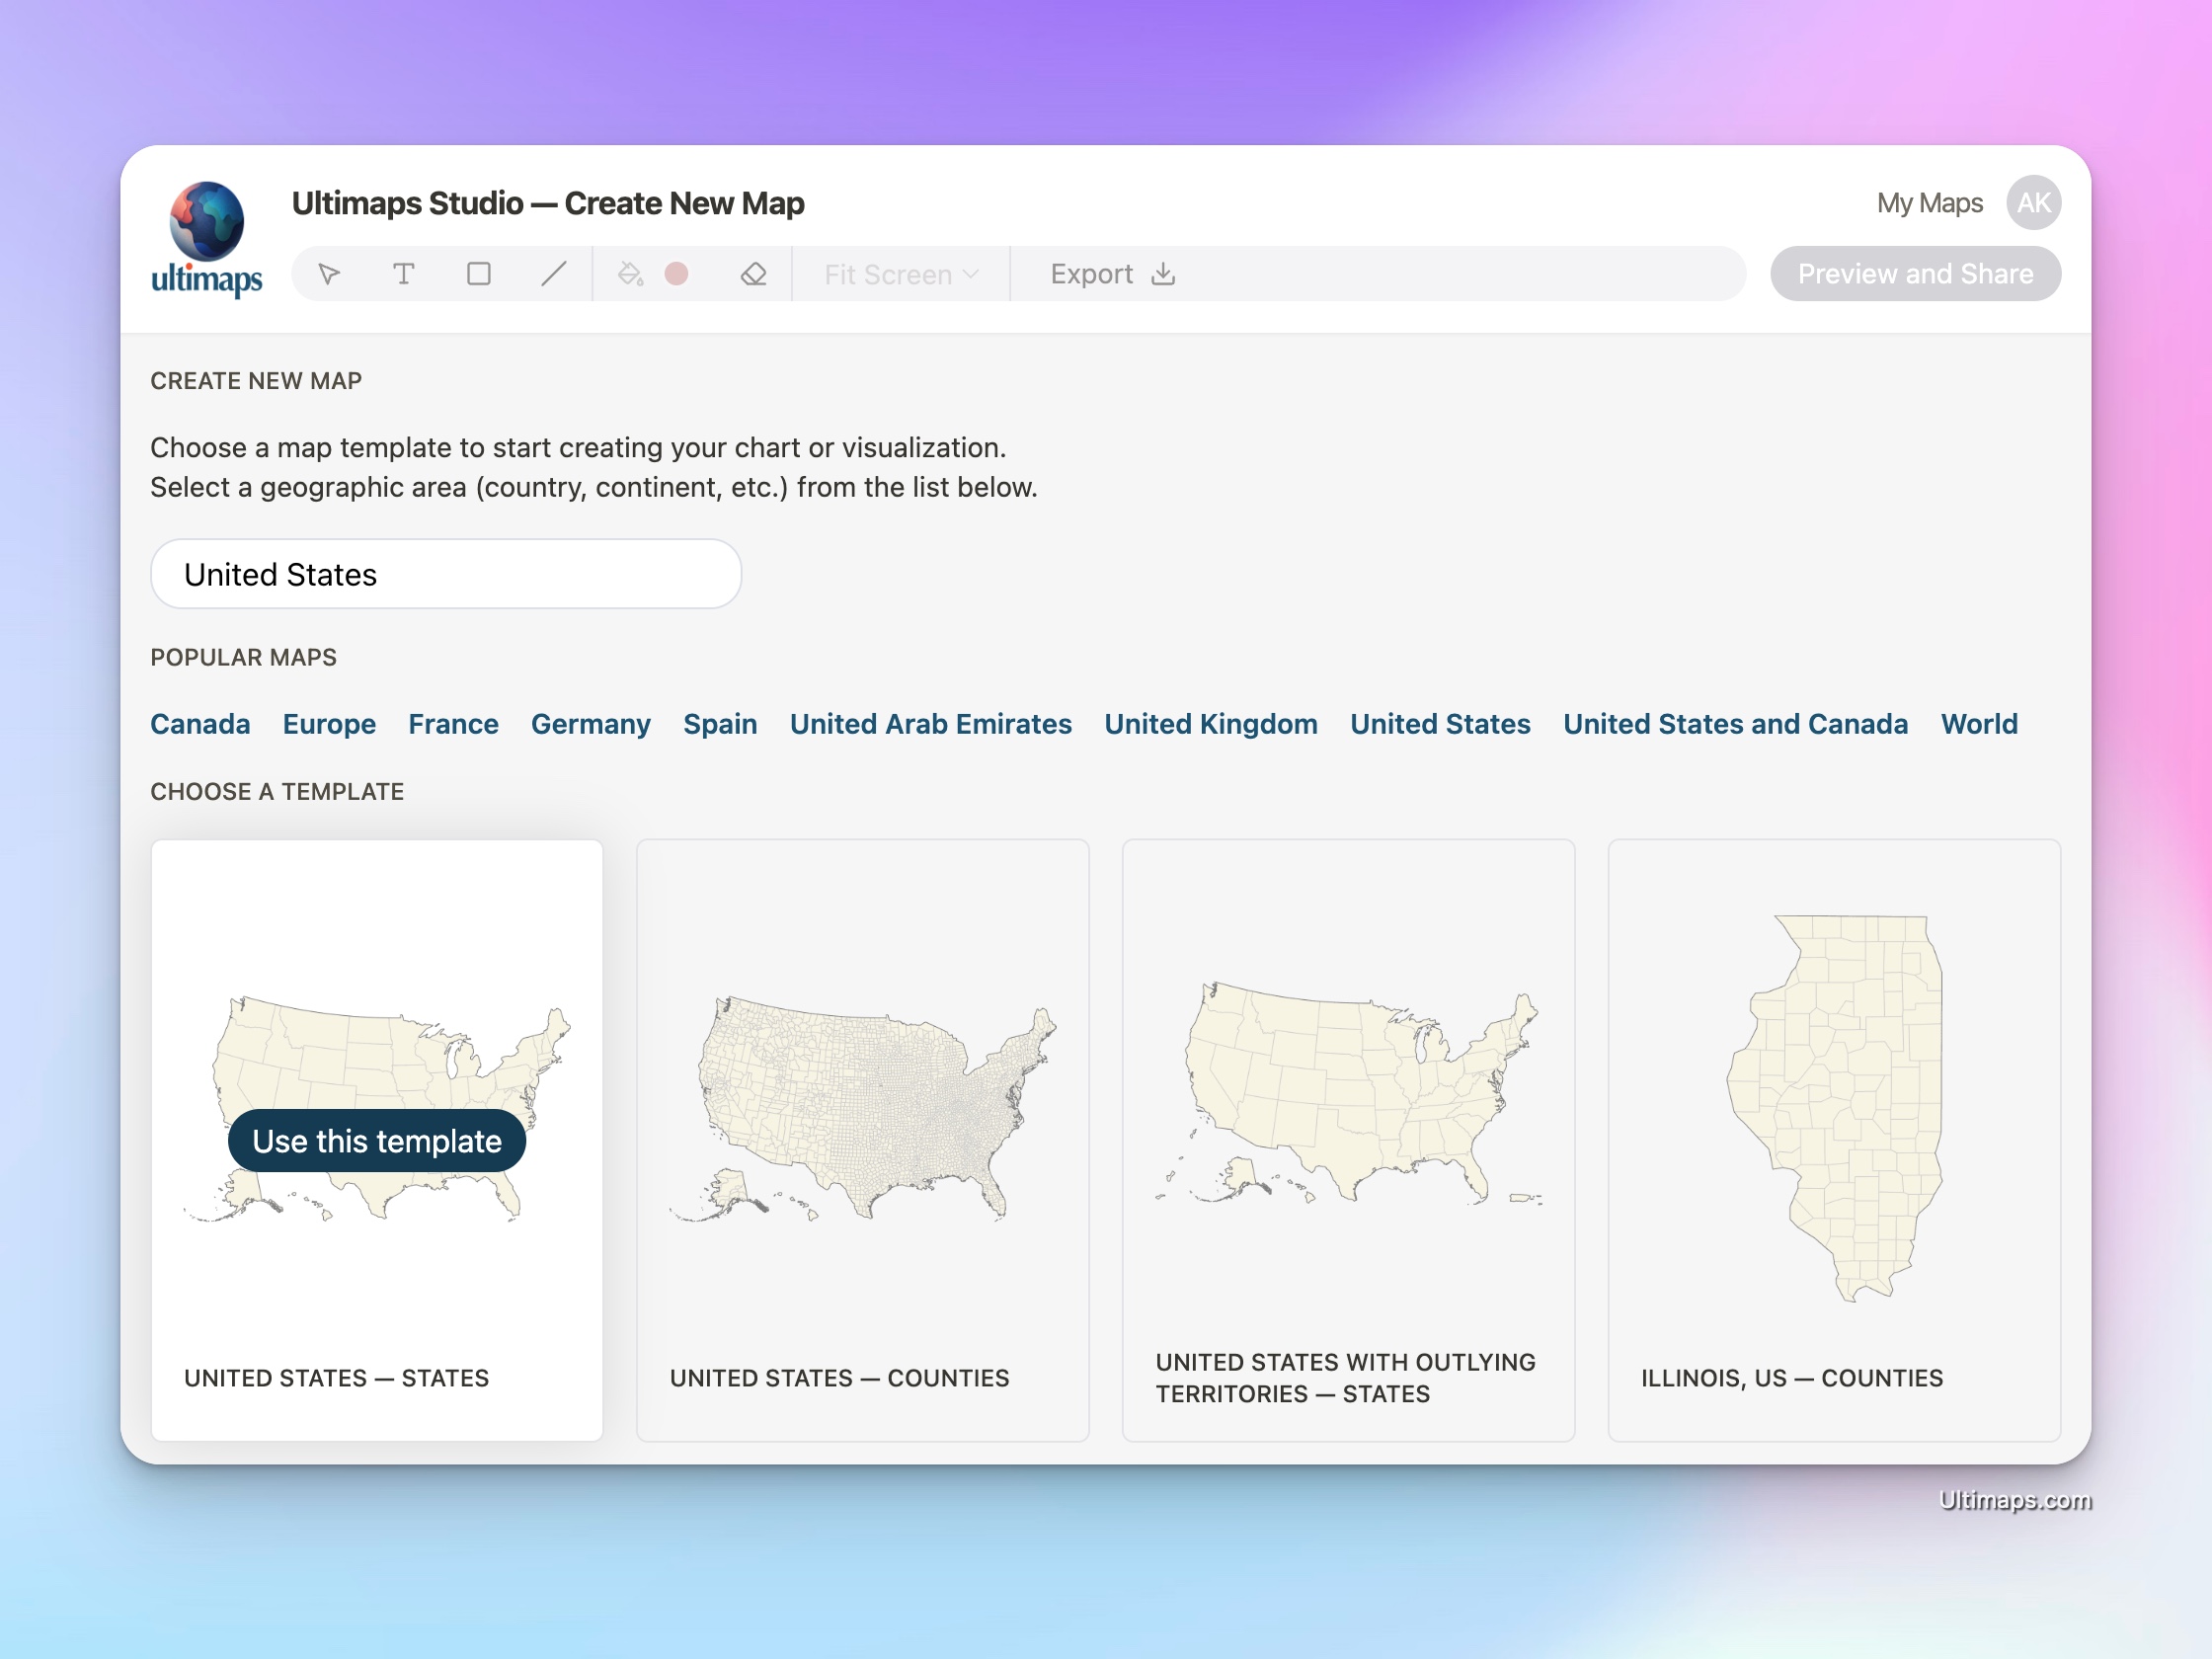
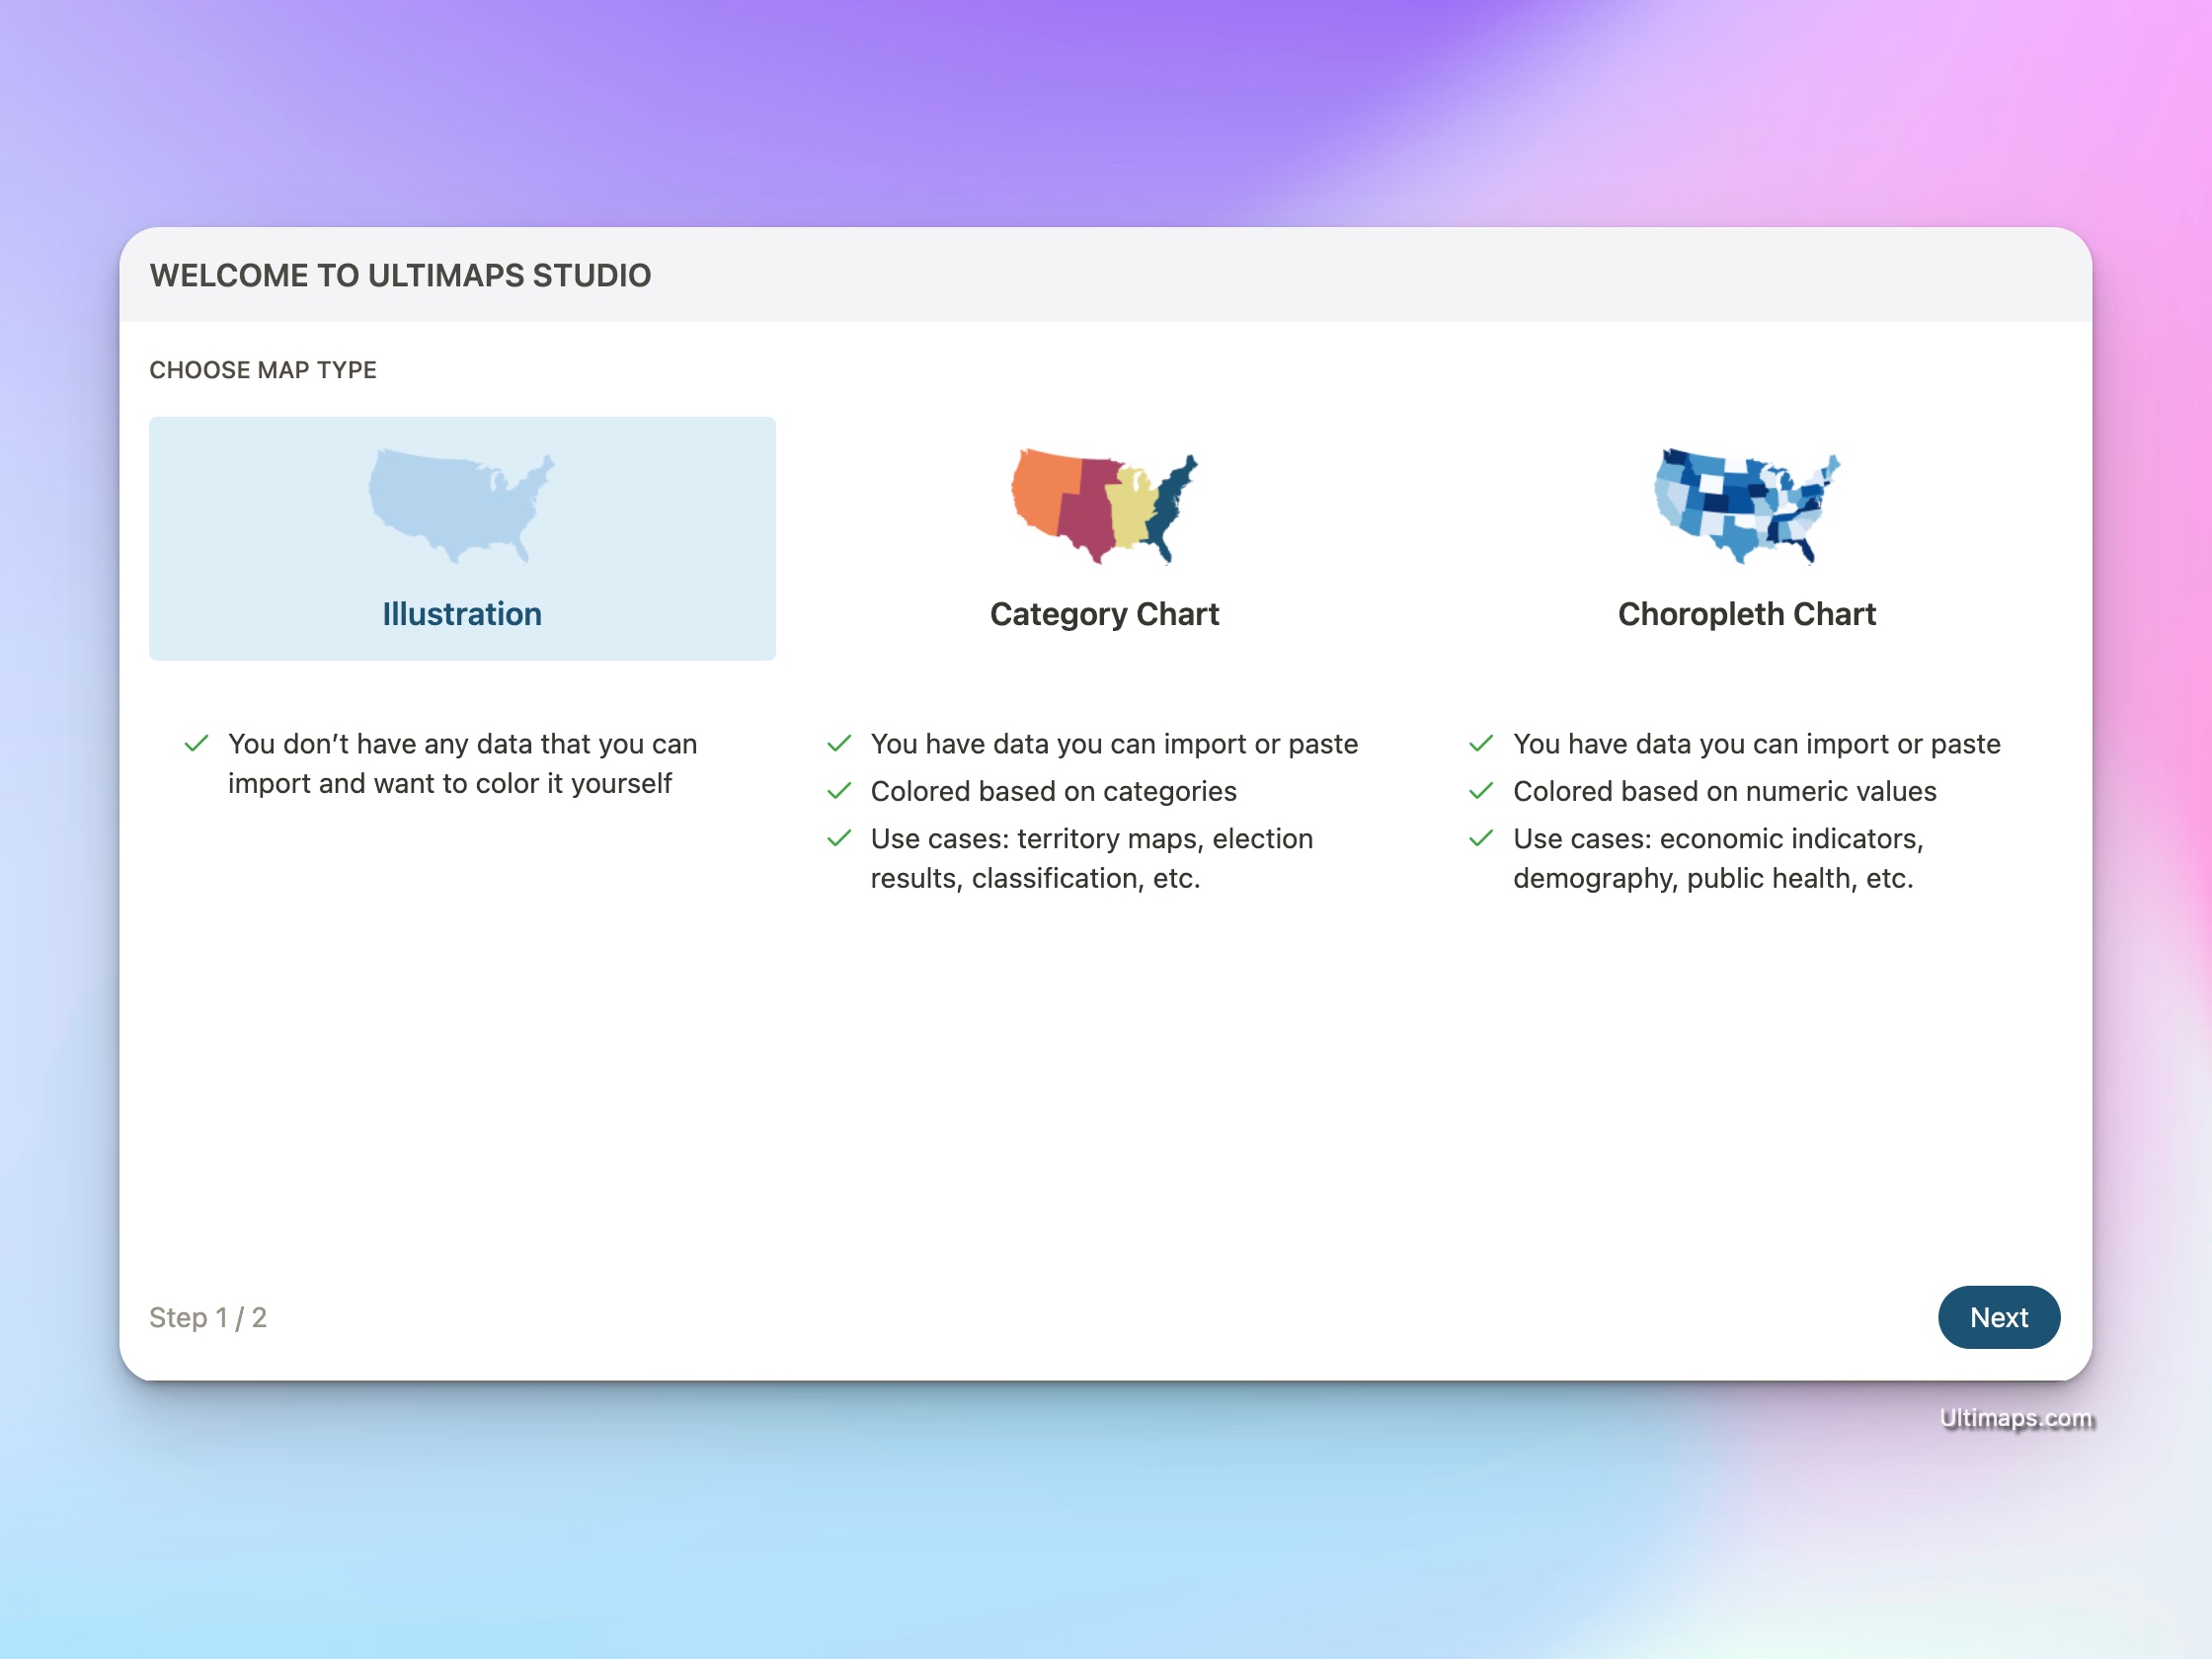
Select "Use this Template" in order to create a new map. On the Wizard screen, let's choose "Illustration Map" and then click "Finish Setup".
Working with the Ultimaps Studio
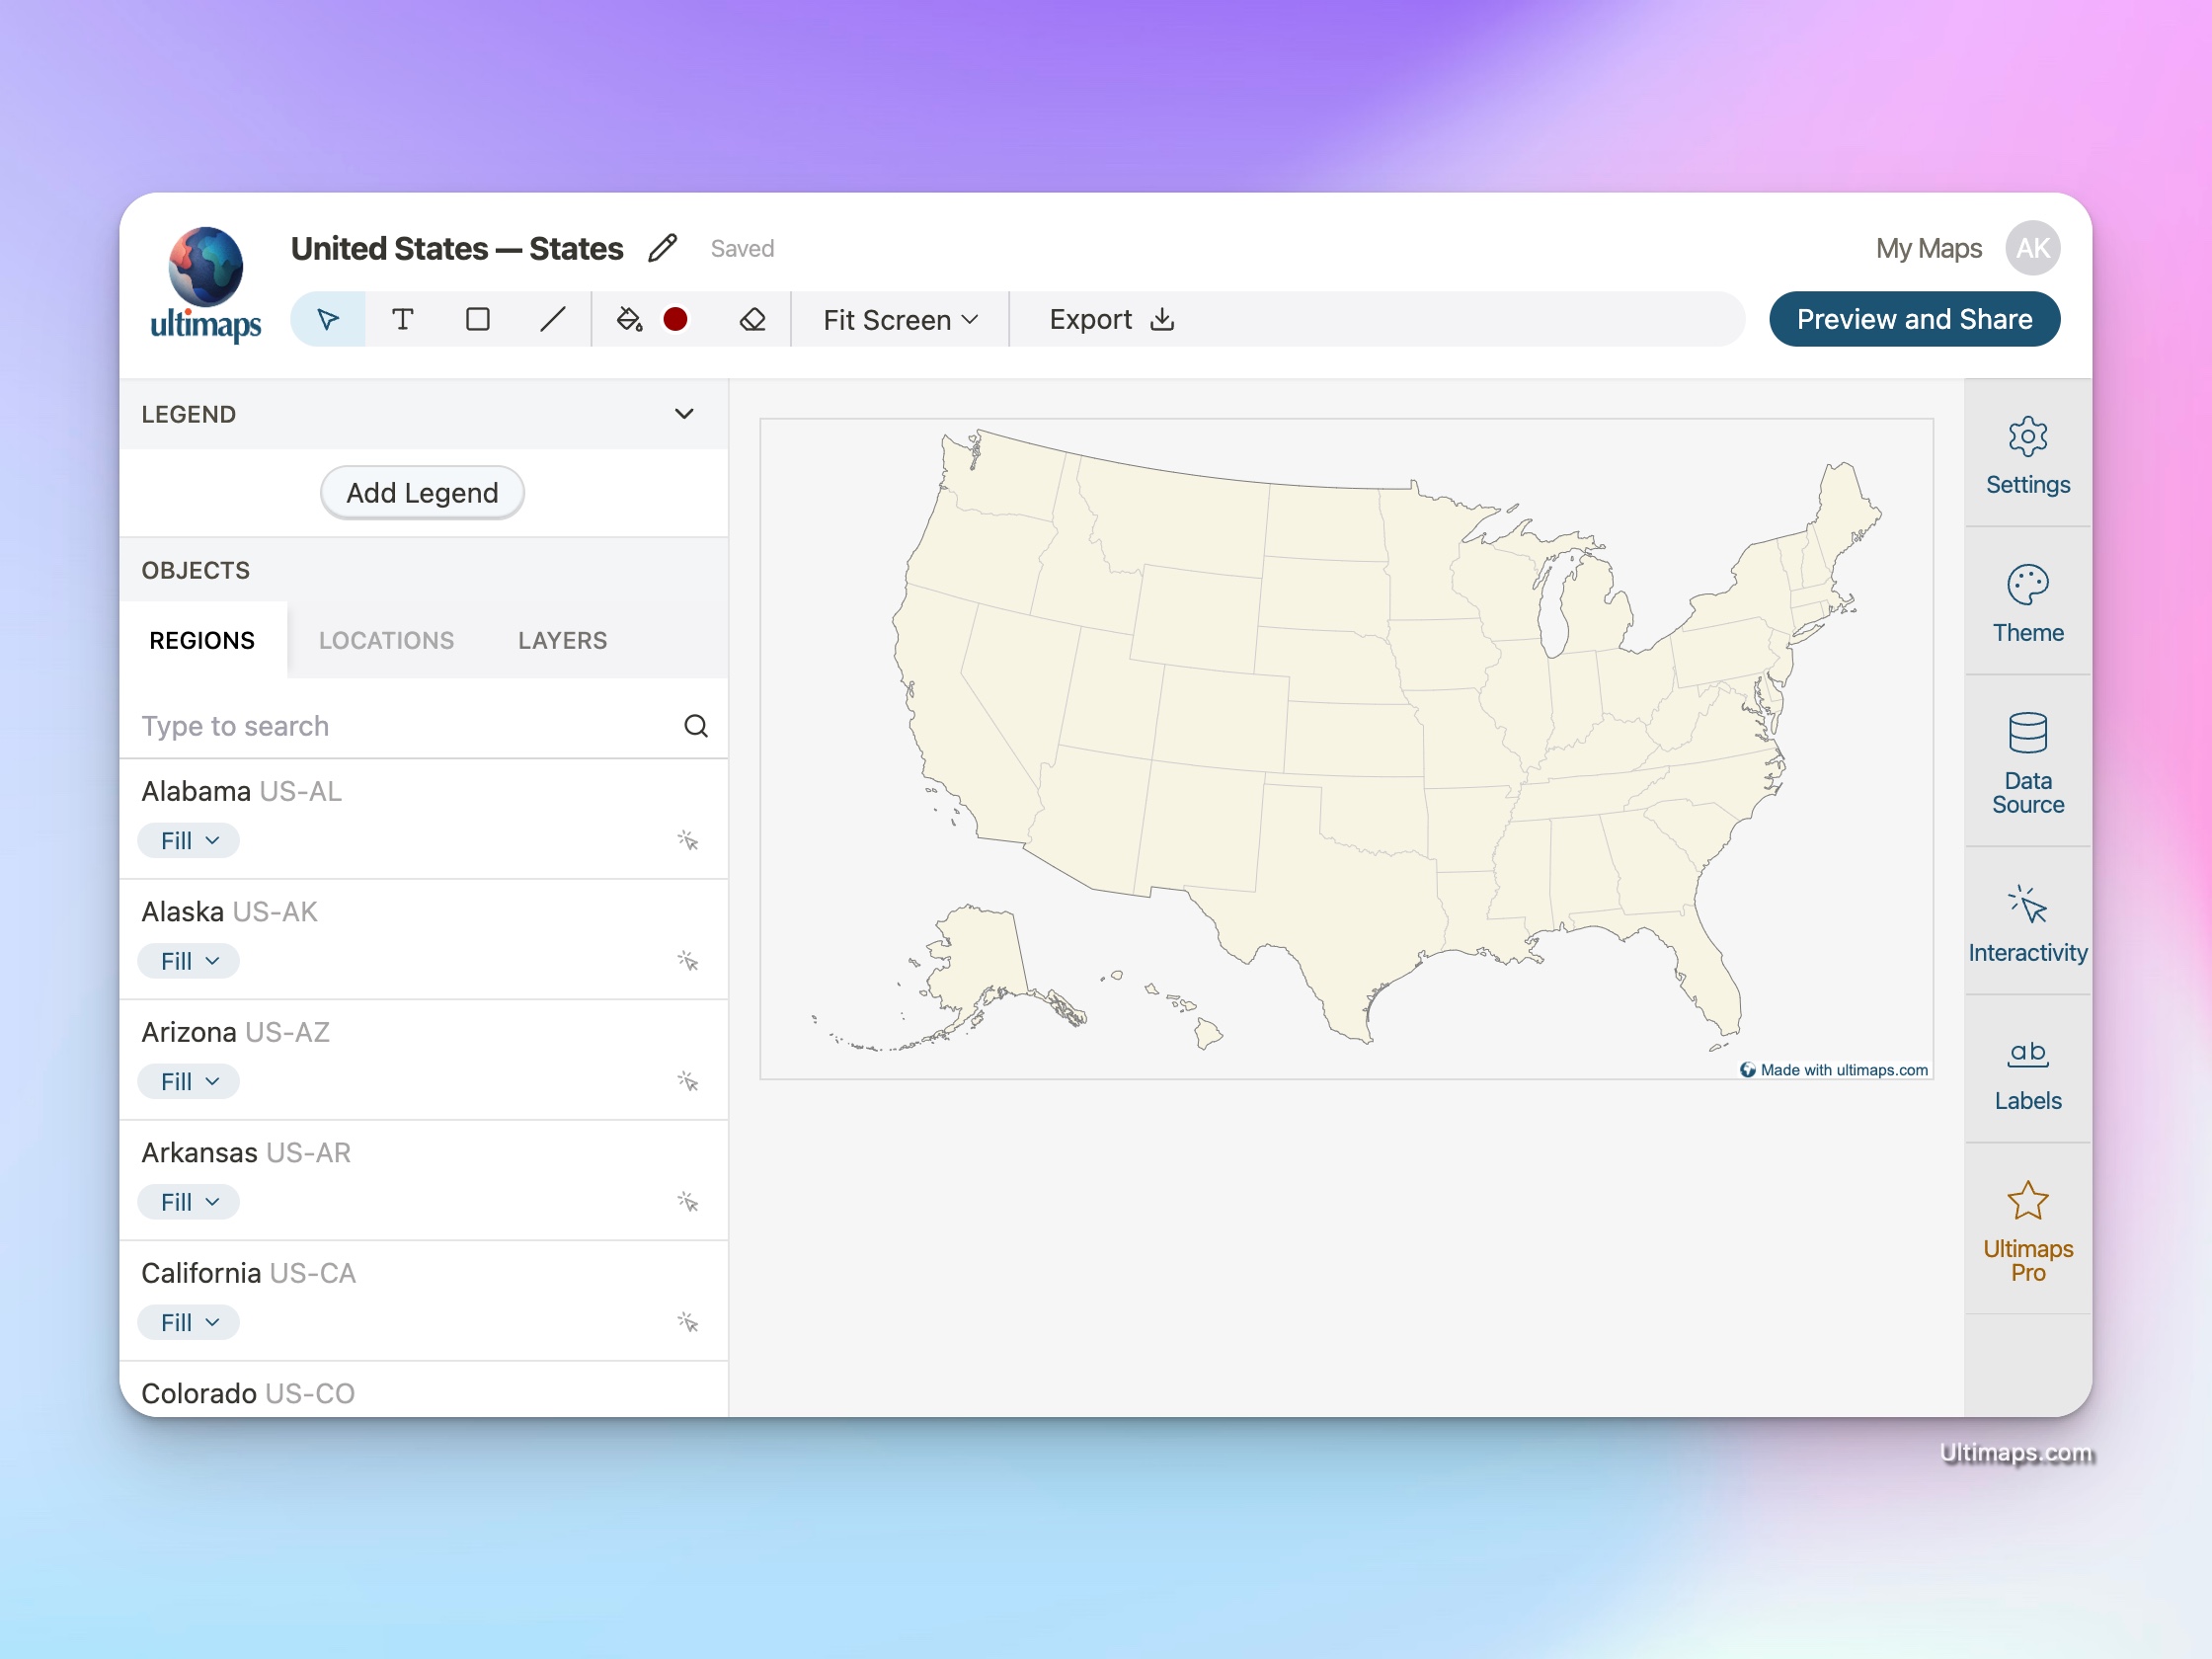
Each visualization is created in a separate document. You can create as many documents as you need. The title of the document is displayed at the top of the screen and can be edited by clicking on it. We strongly recommend you to sign up for an account so you can save your work and share your maps via a link. Once you've logged in, your progress will be automatically saved.
When you're working with a map, you'll see the "Regions" panel on the left. This panel contains all regions (states in our case) that are present on the map.
There is also a toolbar on the top of the screen where you can access different drawing tools, such as rectangles, lines and text. Also there is a "Bucket Fill" tool that allows you to quickly fill a region with a color.
Color-coding States
There are two ways to color the states:
- In the "Regions" panel, find a state you want to color and choose its style by clicking on the "Fill" button.
- Activate the "Bucket Fill" tool in the toolbar and click on the state you want to color.
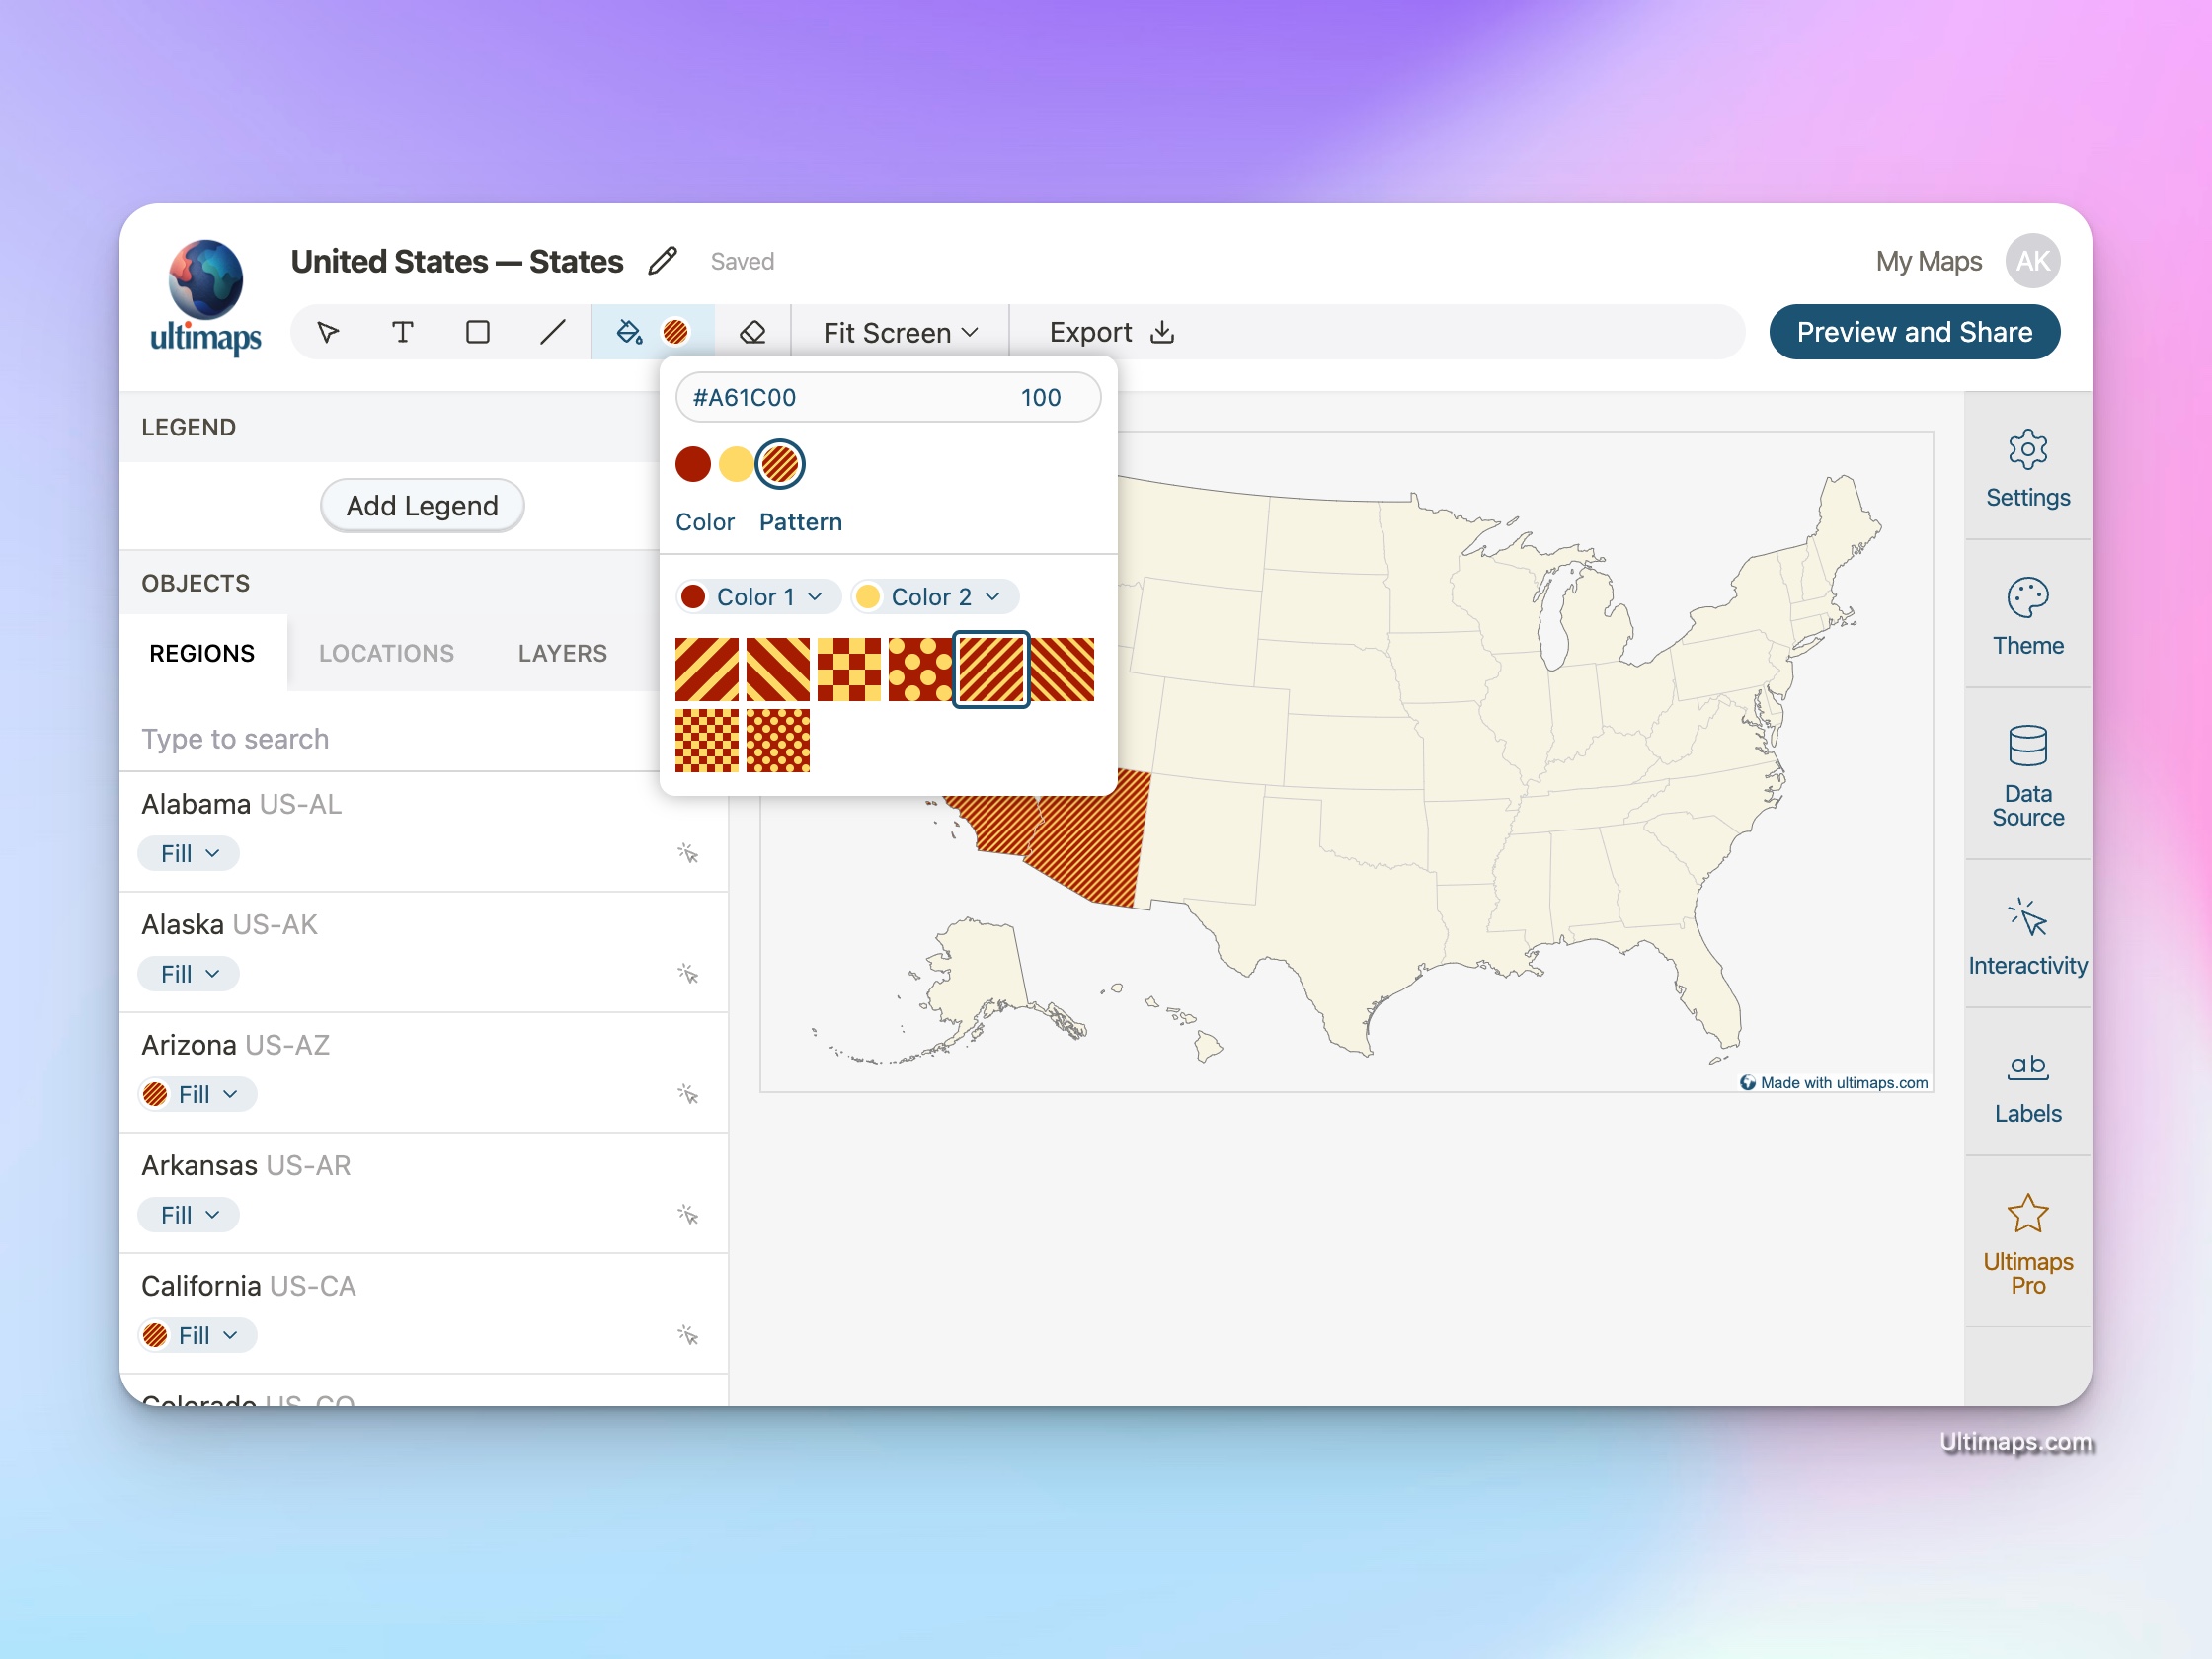
Using Pattern Fills
Sometimes you may want a state to be filled with two colors (for example, to represent two different data points). In such a case, you can use a pattern fill. To do this, switch to the "Pattern" tab in the "Fill" dialog and choose the pattern you want to use. You can also choose the colors for the pattern.
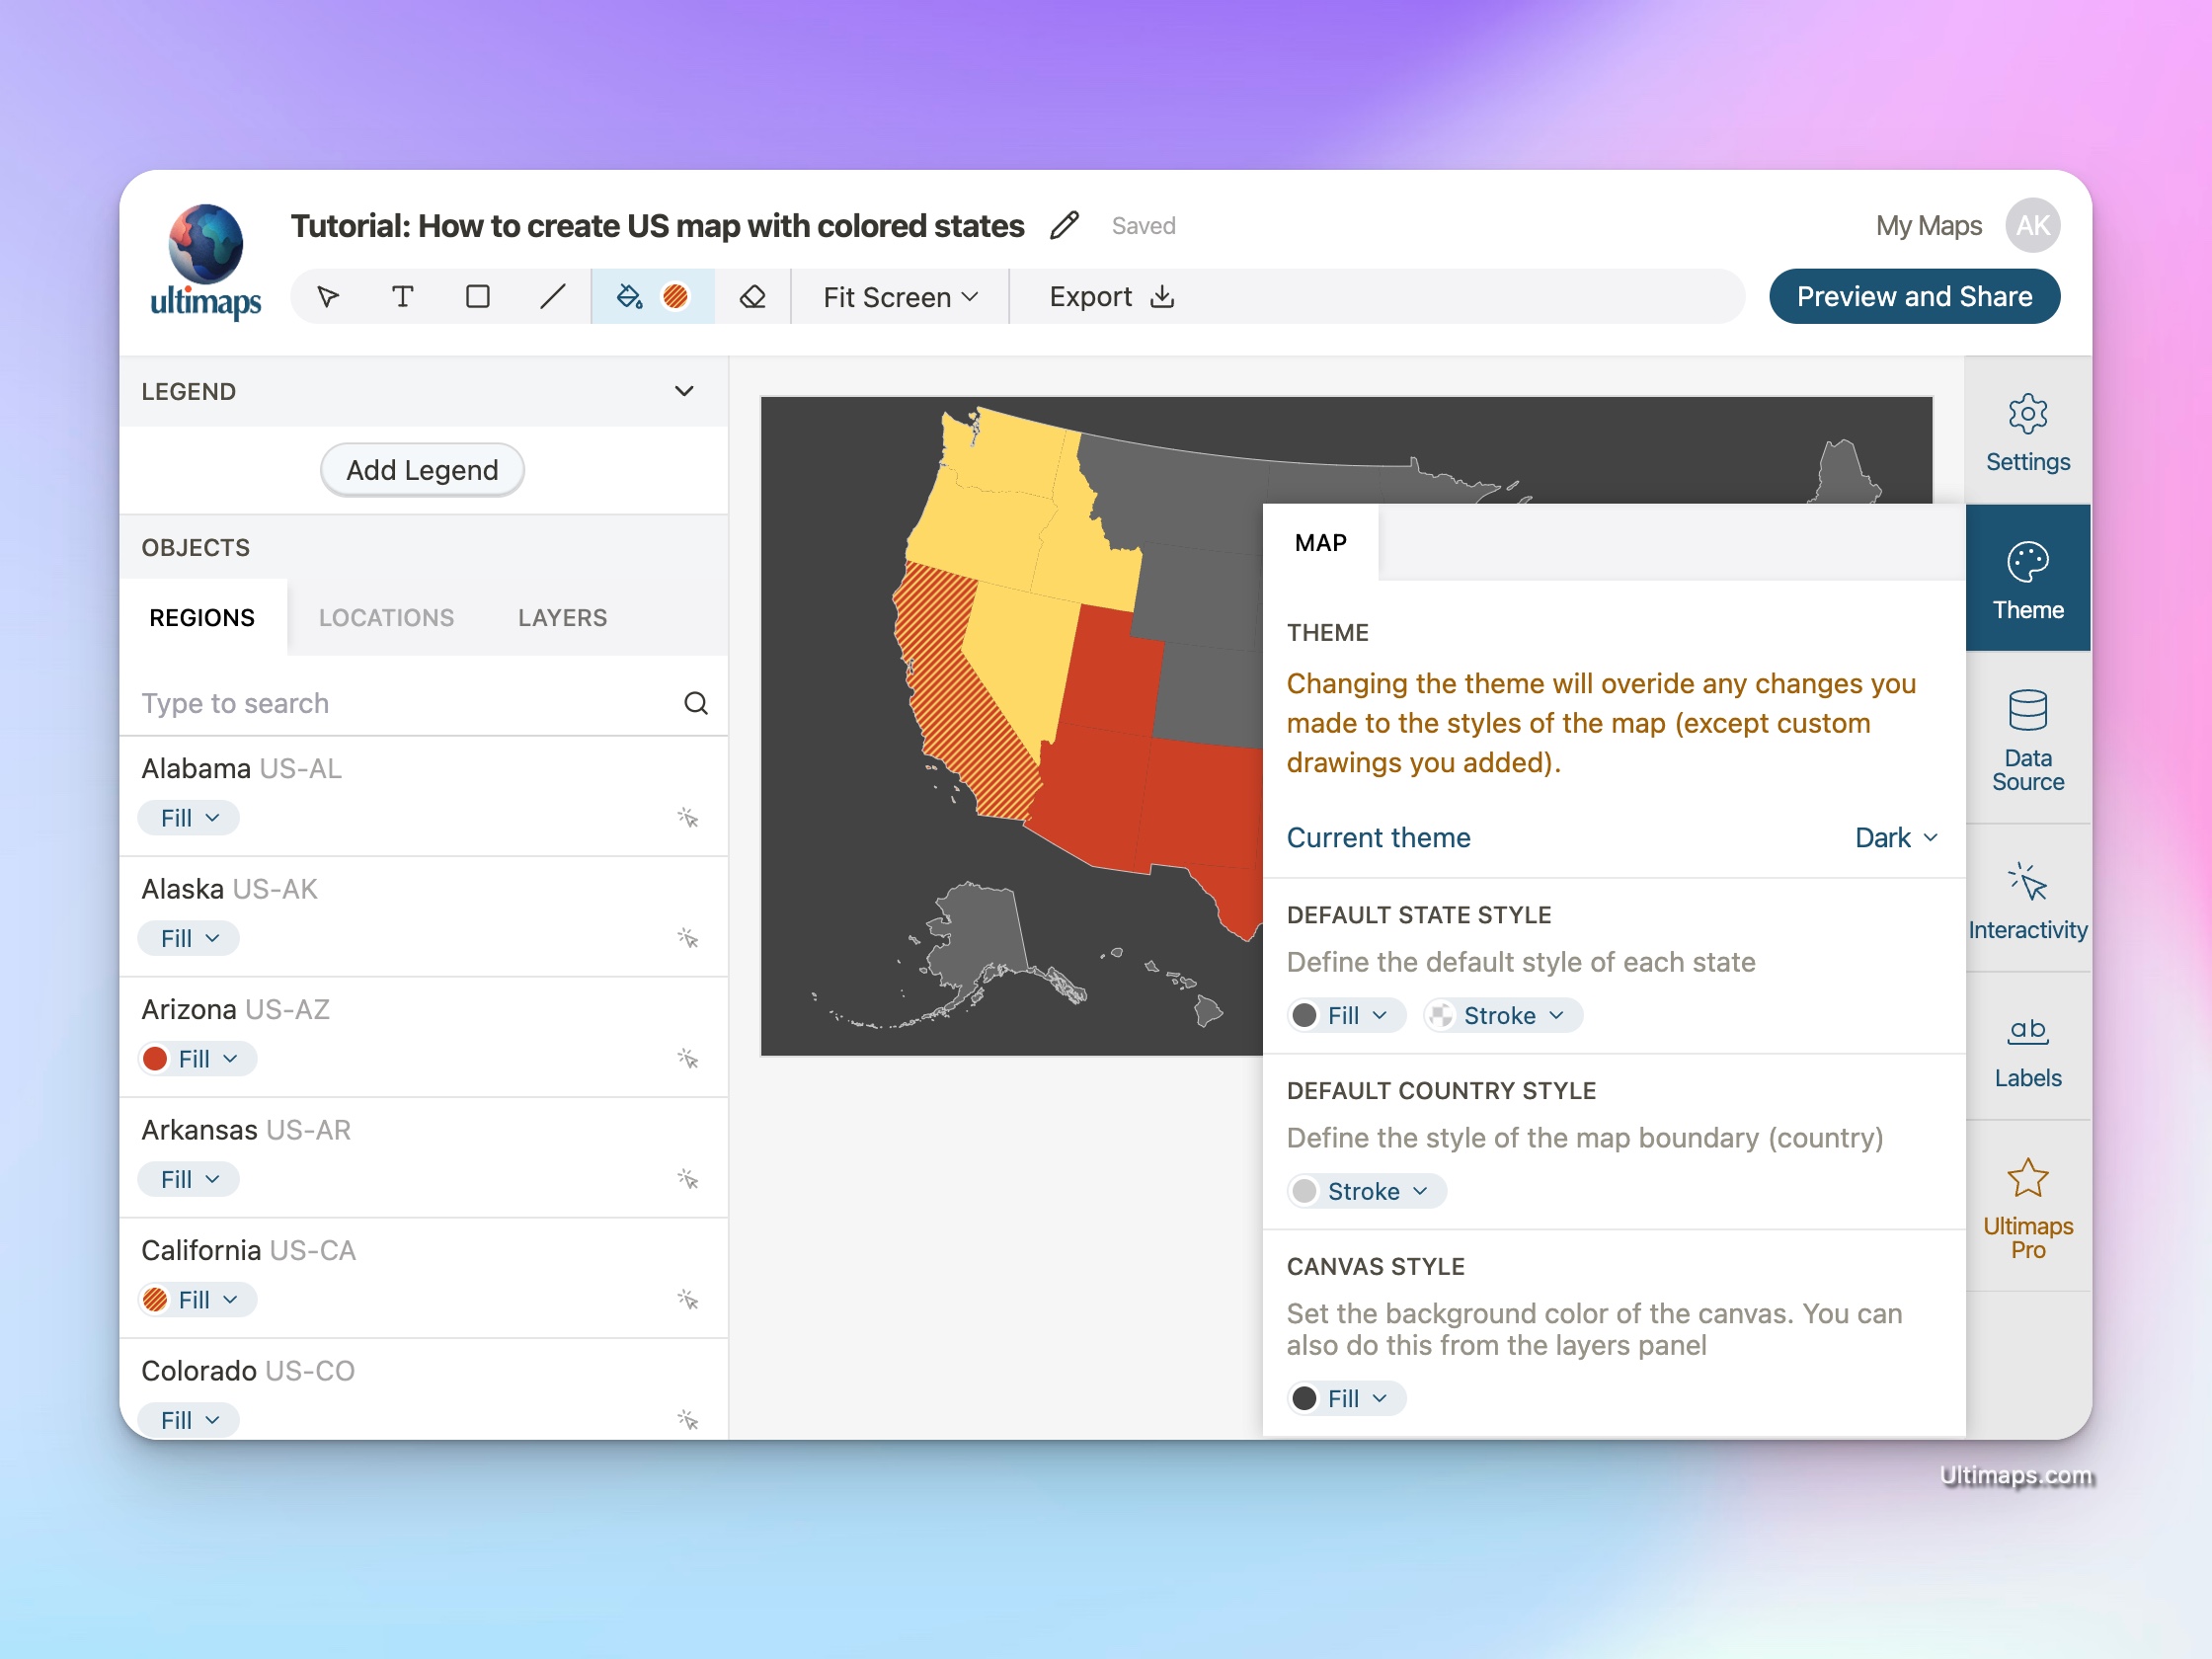
Tweaking Style of the Map
On the right you'll find the "Theme" panel where you can adjust the style of the map. You can change the border color and width, as well as the default fill color of the states.
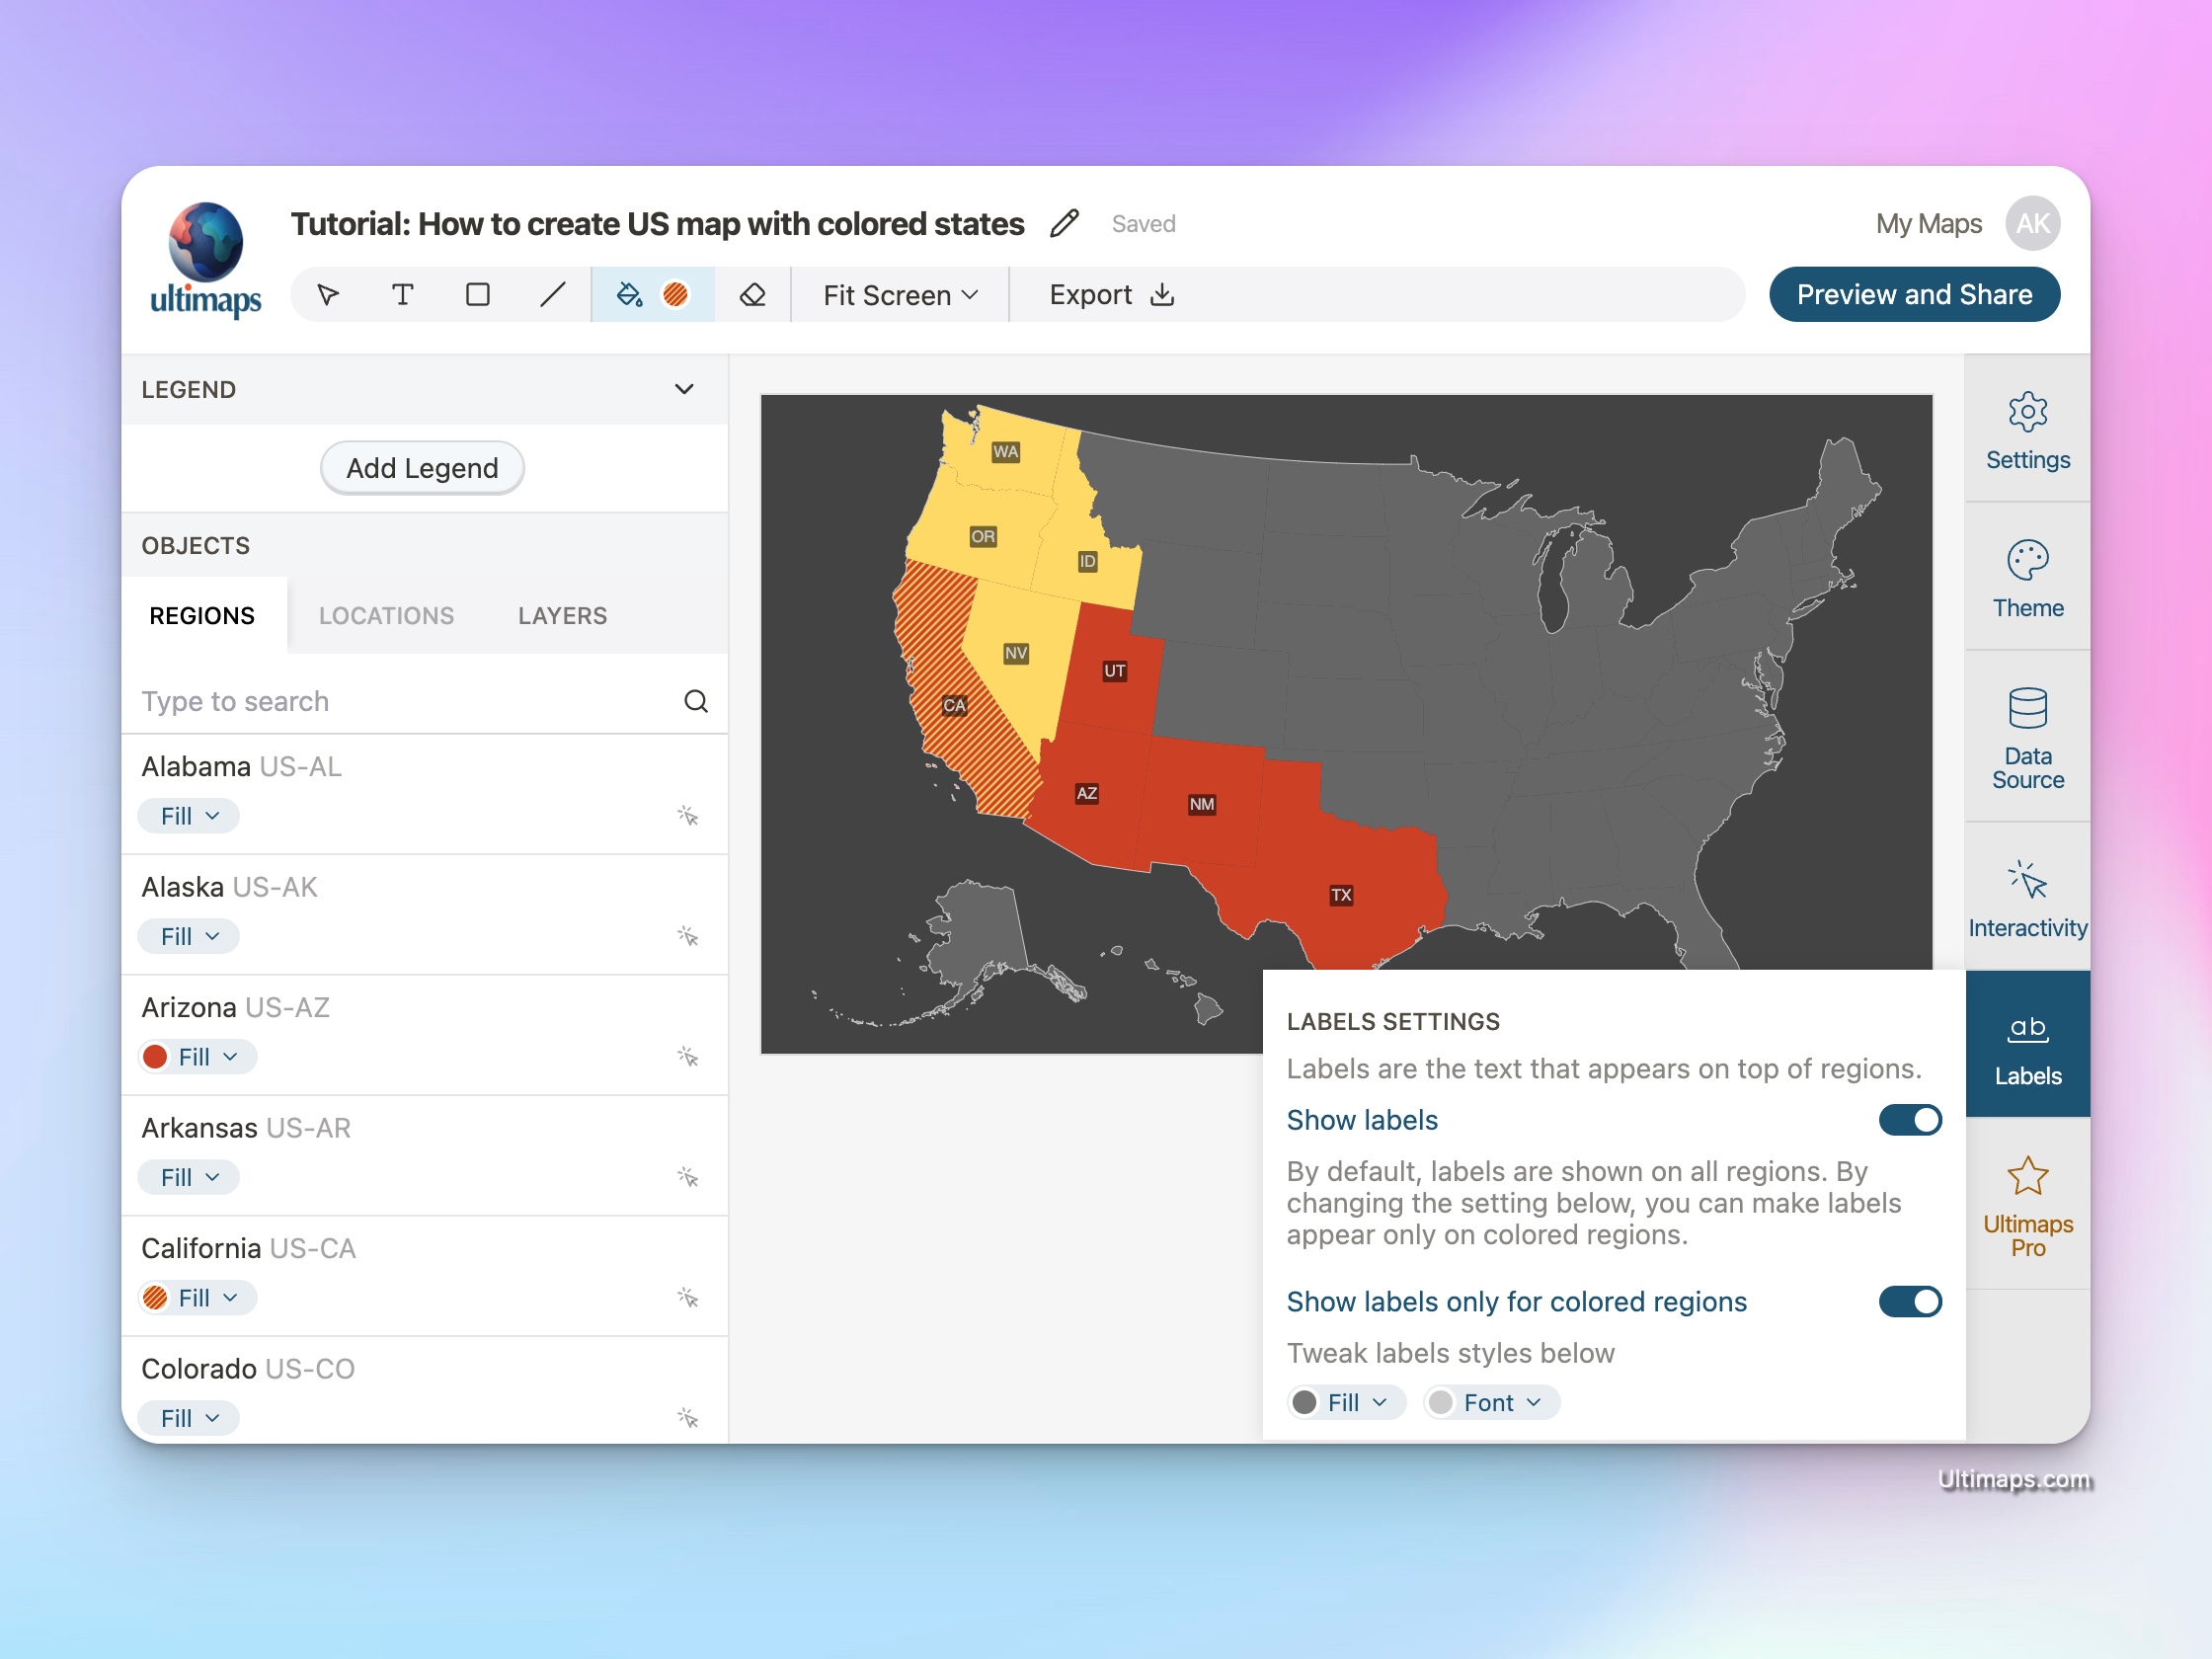
Enabling Labels
To further enhance the readability of your map, you can add labels displaying state abbreviations. To enable labels, click on the "Labels" panel on the right and toggle the "Show Labels" option. You can also choose to show labels only for the regions you've colored.
You can also customize the font color of the labels but note that it can be auto-adjusted based on the background color of the state (e.g. if you colored a state with a light color and the font color is set to white, the font color will be automatically adjusted to black).
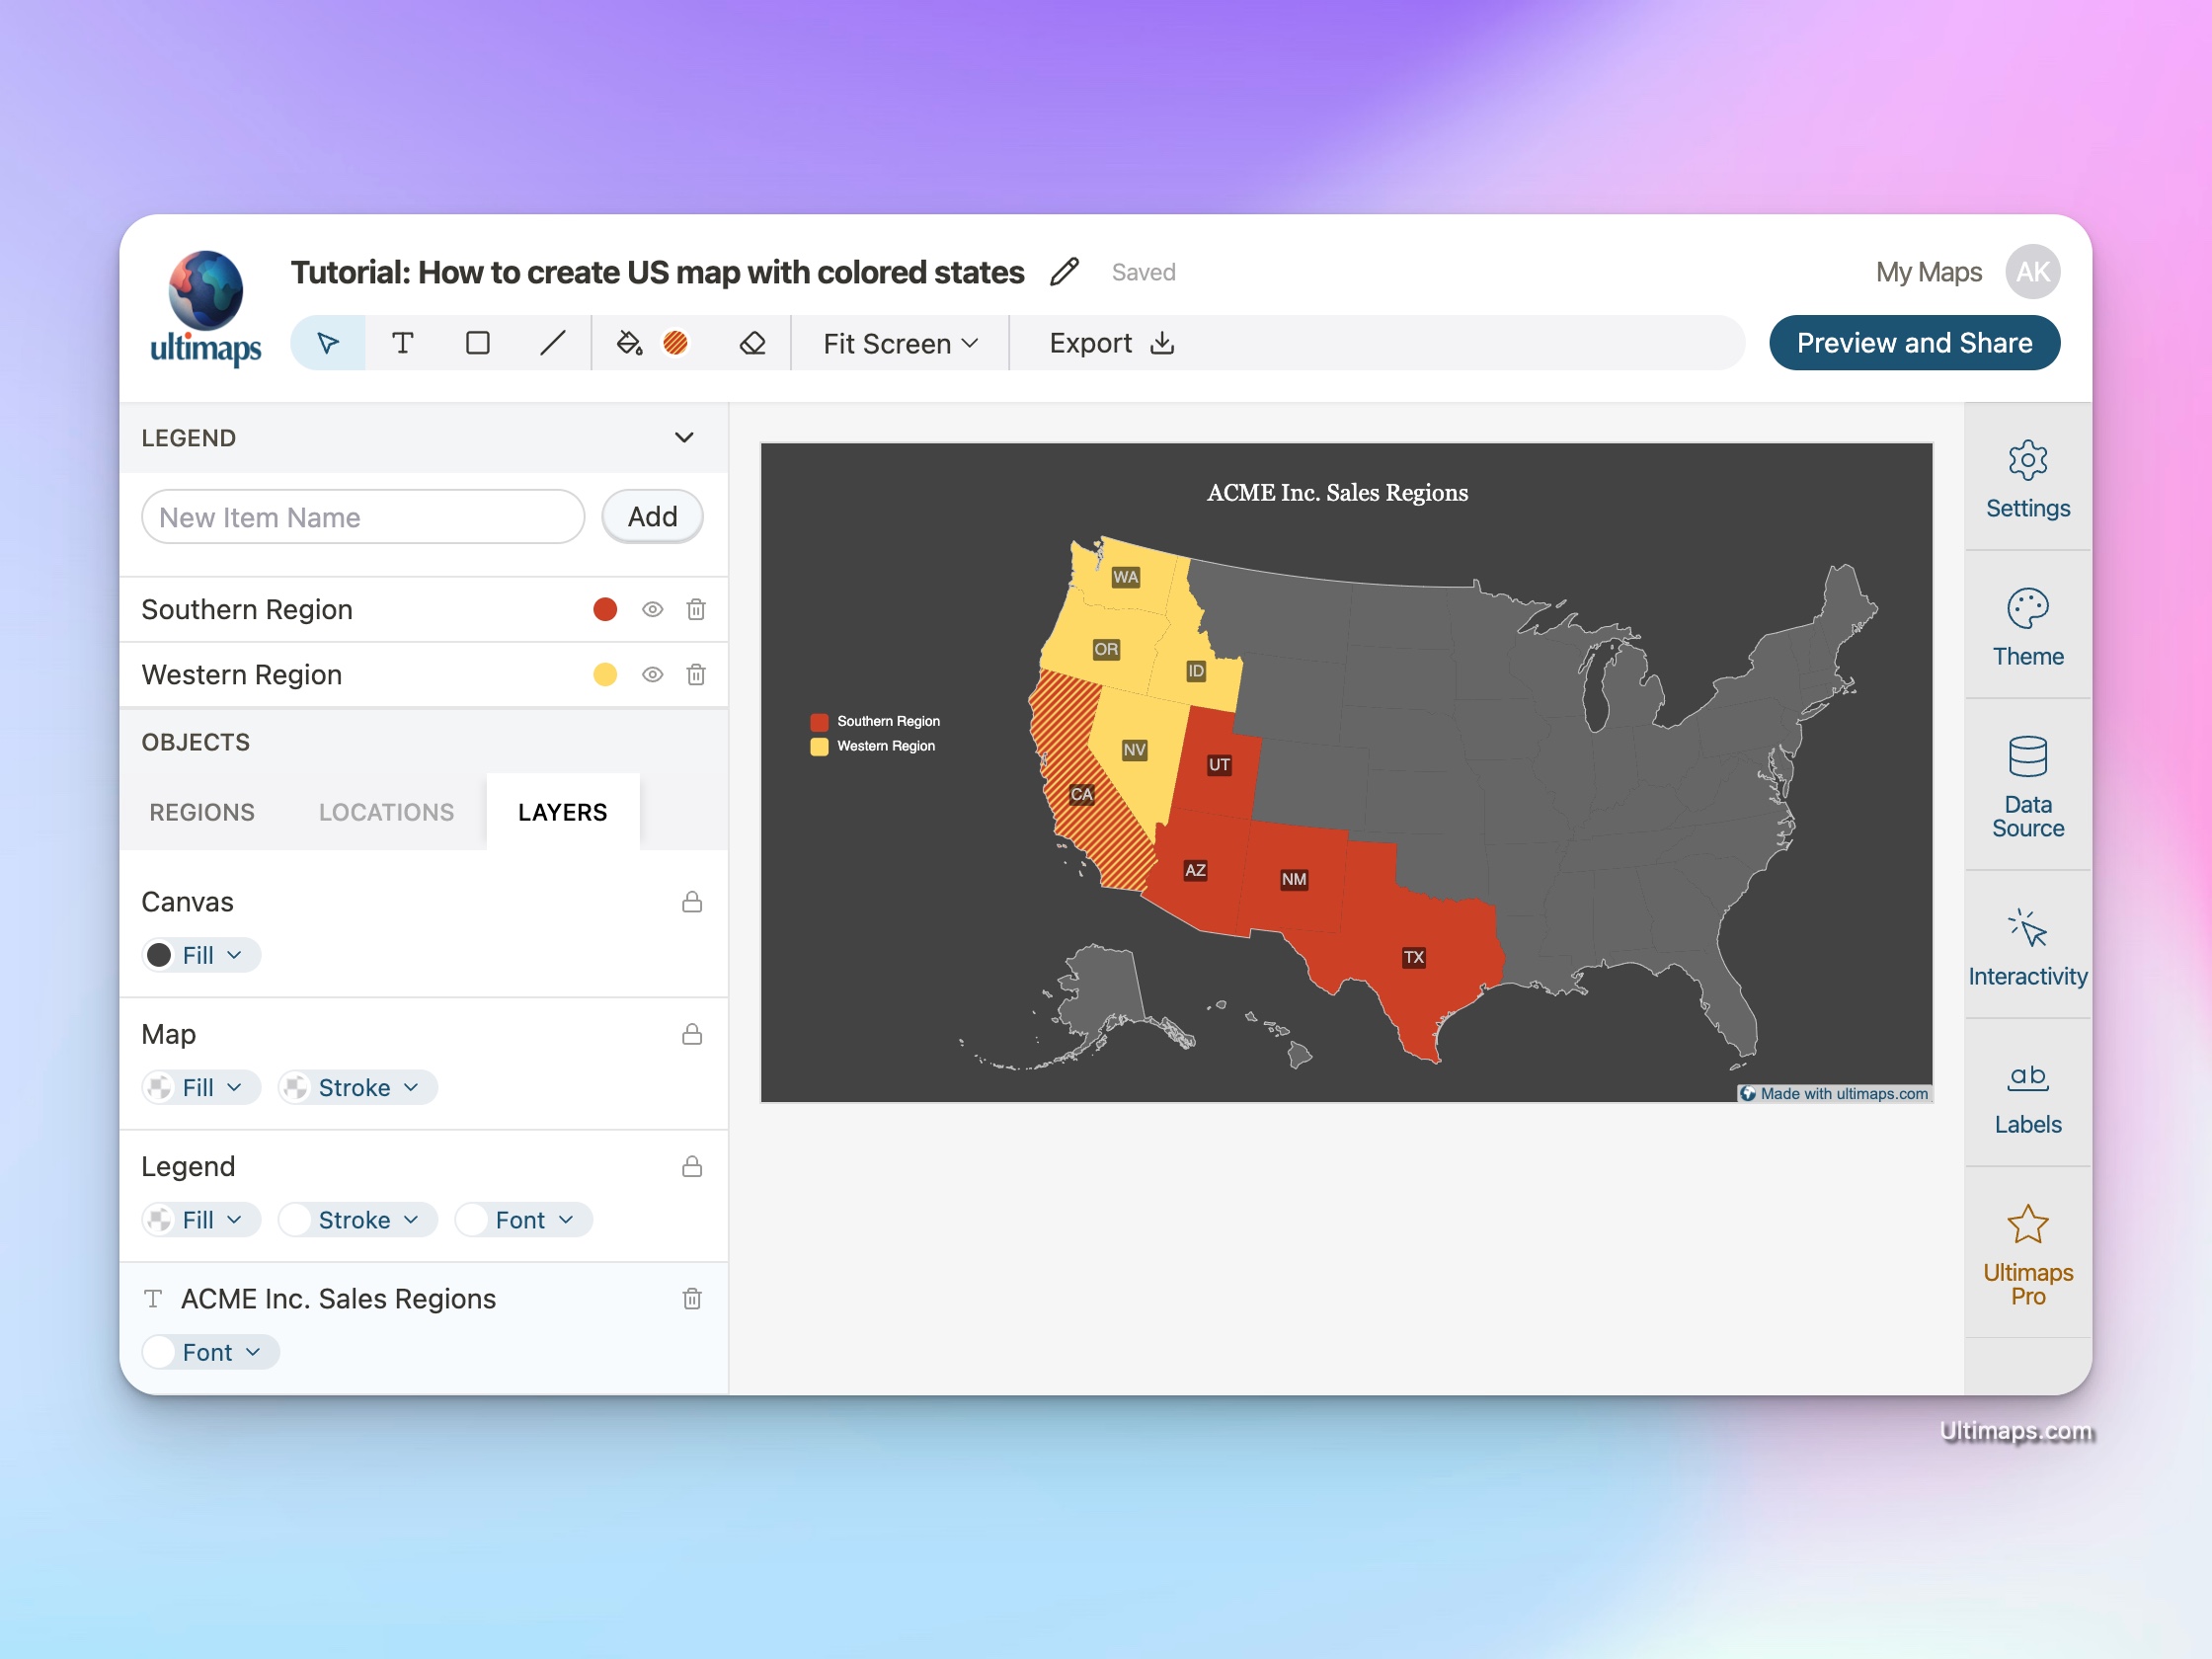
Adding Legend and Further Enhancements
Adding a legend to your map is typically a good practice as it helps explain what each color or pattern represents. To include a legend, click on the "Add Legend" button located in the top left corner. You can incorporate multiple legend items and customize their titles and colors. Additionally, you have the option to modify the legend's appearance, including font style and size, text color, and background color. These adjustments can be made from the "Layers" panel on the left.
By default, the legend appears in the top left corner of the canvas. To prevent overlap with the map, you can use the selection tool to resize the map slightly and reposition the legend as needed.
To enhance your map further, consider adding a title using the "Text" tool. You can customize the text style, including font, size, and color, in the "Layers" panel. This addition will provide context and make your map more informative at a glance.
Exporting the Map
To download your map, click on the "Export" button in the toolbar. You can choose between PNG, SVG and PDF formats.
Sharing your Map with a Link
You might as well share your map with a link. To do this, click on the "Share and Embed" button in the toolbar and hit "Publish". That will give you a shareable link to your map which is now published and visible to everyone.
You can also embed your map on your website by clicking on the "Share and Embed" button in the toolbar and then "View Embed Code".
Conclusion
We hope you found this guide helpful. Start creating your first map by navigating to Ultimaps Studio. No signup is required to start. Happy mapping!