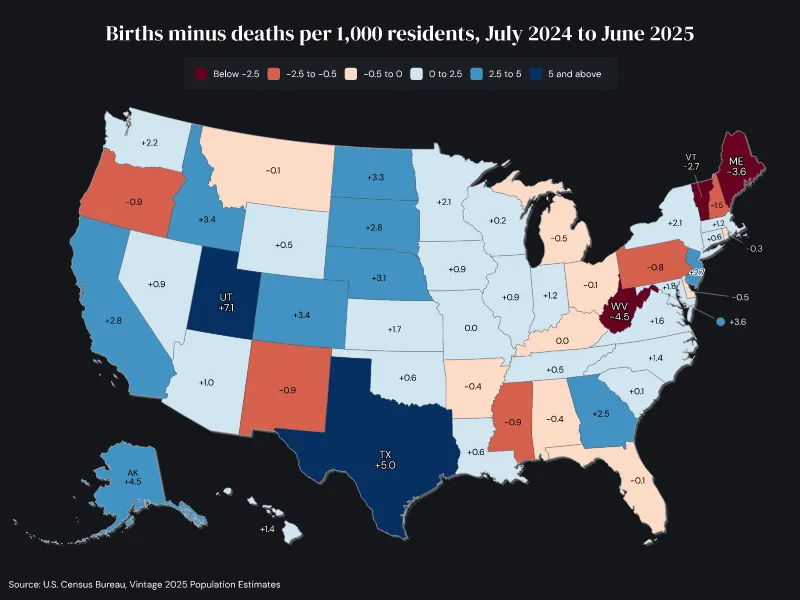
Births minus deaths per 1,000 residents, July 2024 to June 2025
More deaths than births: 17 states had negative natural change in 2025, including Florida. Source: U.S. Census Bureau, Population Estimates Program, Vintage 2025, "Estimated Components of Resident Population Change", period July 1, 2024 to June 30, 2025.
by UltimapsLast updated
Remix opens a copy of this map, data included, for you to change. Free, no sign-up to start.
Source: U.S. Census BureauData for
Highest+7.1Utah
Lowest-4.5West Virginia
Regions51all with data
Data
| # | Region | Value |
|---|---|---|
| 1 | Utah | +7.1 |
| 2 | Texas | +5.0 |
| 3 | Alaska | +4.5 |
| 4 | District of Columbia | +3.6 |
| 5 | Colorado | +3.4 |
| 5 | Idaho | +3.4 |
| 7 | North Dakota | +3.3 |
| 8 | Nebraska | +3.1 |
| 9 | California | +2.8 |
| 9 | South Dakota | +2.8 |
| 11 | New Jersey | +2.7 |
| 12 | Georgia | +2.5 |
| 13 | Washington | +2.2 |
| 14 | Minnesota | +2.1 |
| 14 | New York | +2.1 |
| 16 | Maryland | +1.8 |
| 17 | Kansas | +1.7 |
| 18 | Virginia | +1.6 |
| 19 | Hawaii | +1.4 |
| 19 | North Carolina | +1.4 |
| 21 | Indiana | +1.2 |
| 21 | Massachusetts | +1.2 |
| 23 | Arizona | +1.0 |
| 24 | Illinois | +0.9 |
| 24 | Iowa | +0.9 |
| 24 | Nevada | +0.9 |
| 27 | Connecticut | +0.6 |
| 27 | Louisiana | +0.6 |
| 27 | Oklahoma | +0.6 |
| 30 | Tennessee | +0.5 |
| 30 | Wyoming | +0.5 |
| 32 | Wisconsin | +0.2 |
| 33 | South Carolina | +0.1 |
| 34 | Missouri | 0.0 |
| 35 | Kentucky | 0.0 |
| 36 | Florida | -0.1 |
| 36 | Montana | -0.1 |
| 36 | Ohio | -0.1 |
| 39 | Rhode Island | -0.3 |
| 40 | Alabama | -0.4 |
| 40 | Arkansas | -0.4 |
| 42 | Delaware | -0.5 |
| 42 | Michigan | -0.5 |
| 44 | Pennsylvania | -0.8 |
| 45 | Mississippi | -0.9 |
| 45 | New Mexico | -0.9 |
| 45 | Oregon | -0.9 |
| 48 | New Hampshire | -1.5 |
| 49 | Vermont | -2.7 |
| 50 | Maine | -3.6 |
| 51 | West Virginia | -4.5 |