Ultimaps Apr'24 Release: Create Maps with AI, Draw Lines and Text
The latest release contained numerous fixes and improvements to the existing logic. Moreover, we shipped several cool features, and one of them is our integration with AI that allows you to type your instructions or paste your data in free text, and get your map done.
What's included in this update:
- Line tool and reengineered text tool
- Creating maps with AI
- Improved wizard
- Hiding and reordering categories
- New maps
Let's take a closer look at each feature.
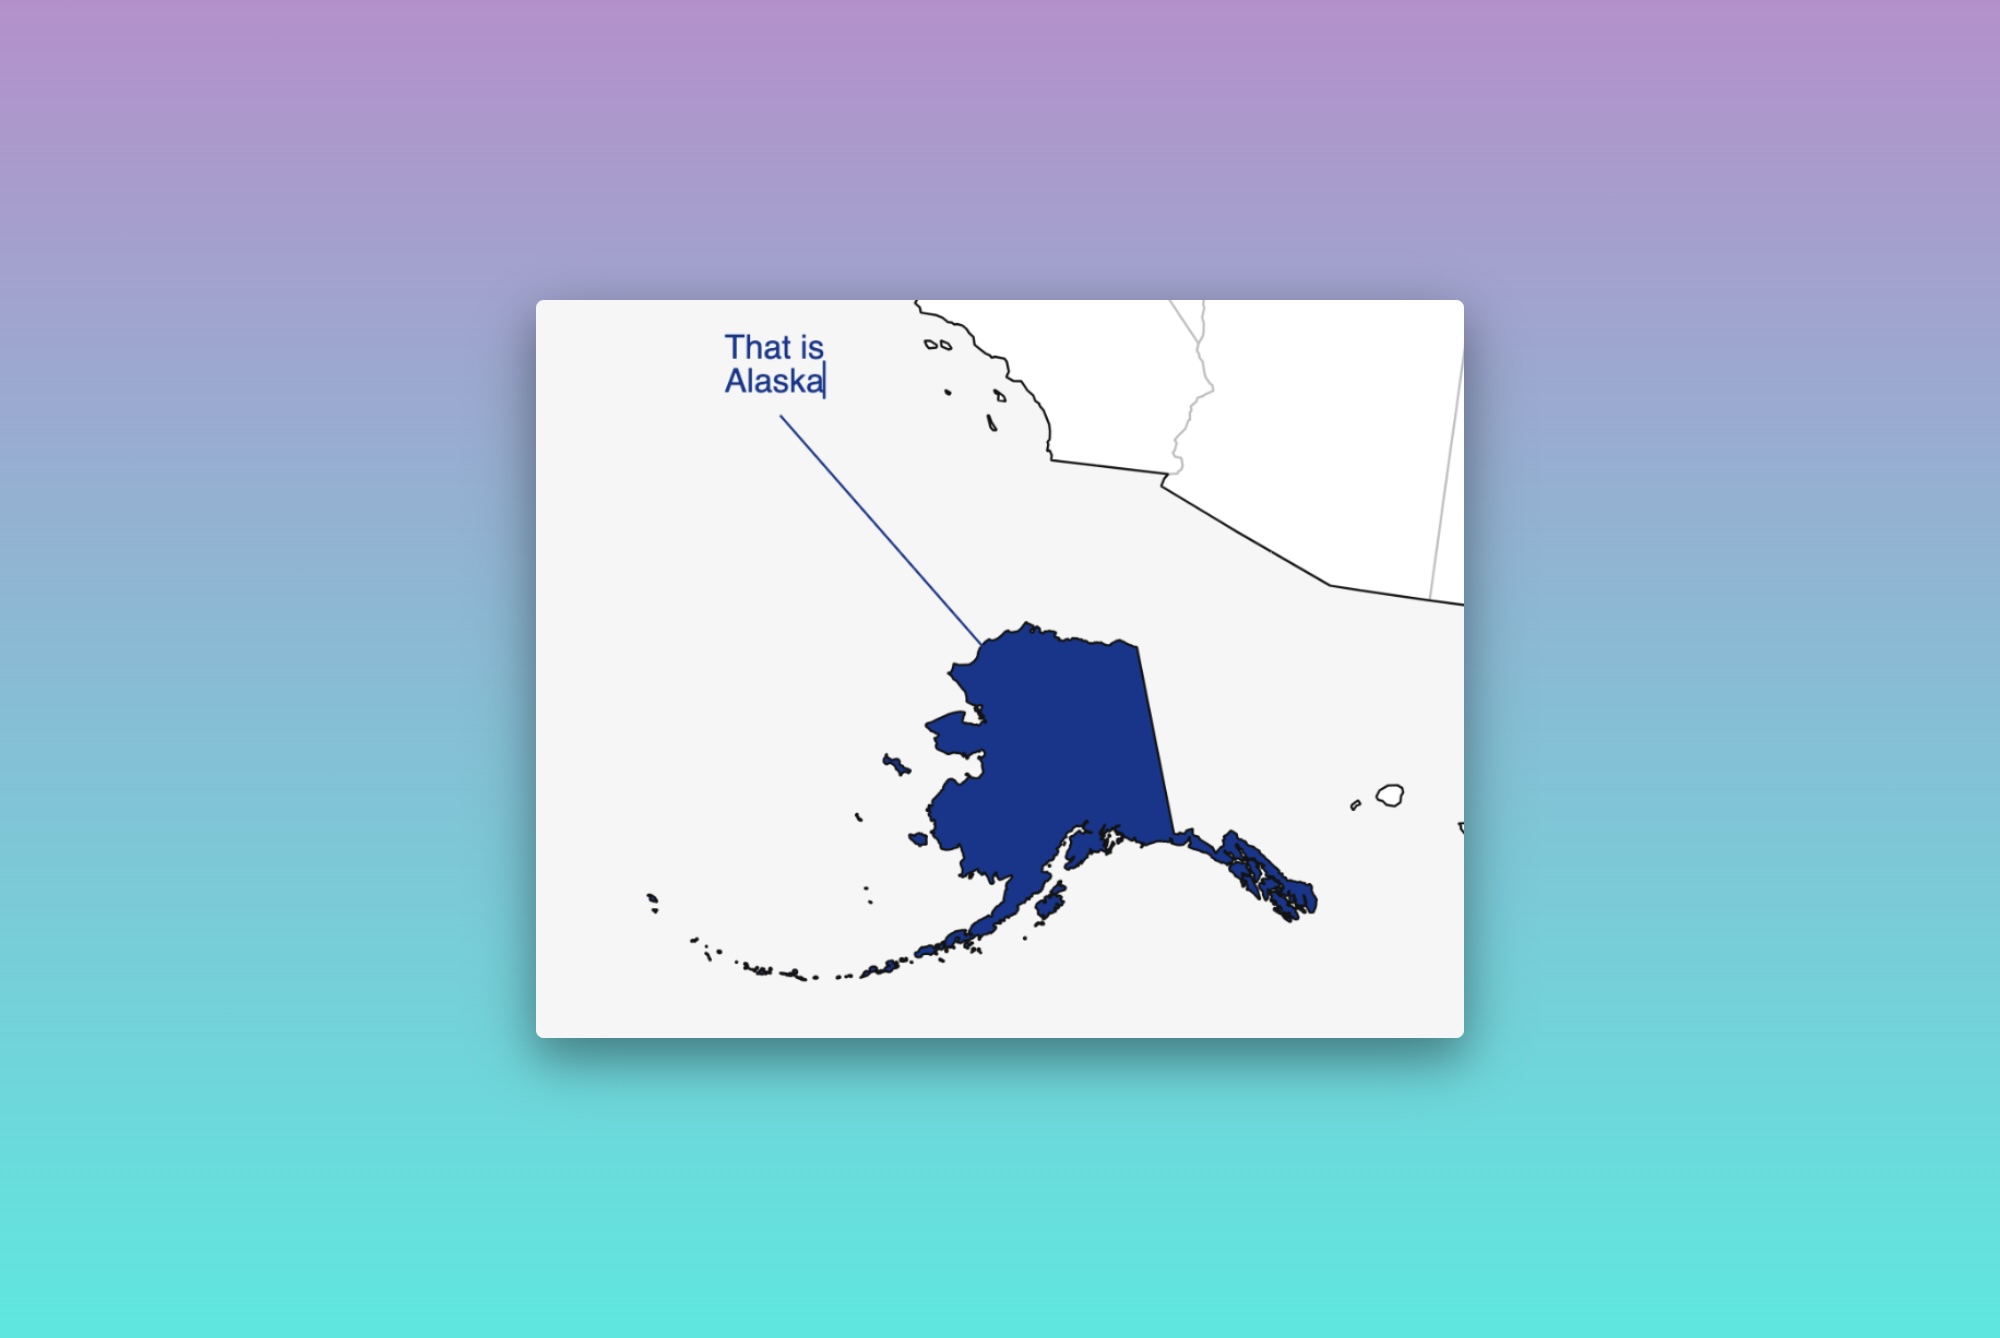
Line Tool and Reengineered Text Tool
To further enhance your storytelling abilities, we've introduced the line tool and improved the text tool. Both of these tools allow you to highlight specific areas and emphasize key points in your visualizations.
Creating Maps with AI
With integrated AI, you can now create map charts even more easily. When you create a new map chart, select the Category or Choropleth map option, and then choose the "Use AI" option. Type your instructions or paste your raw data, and get your map done in seconds.
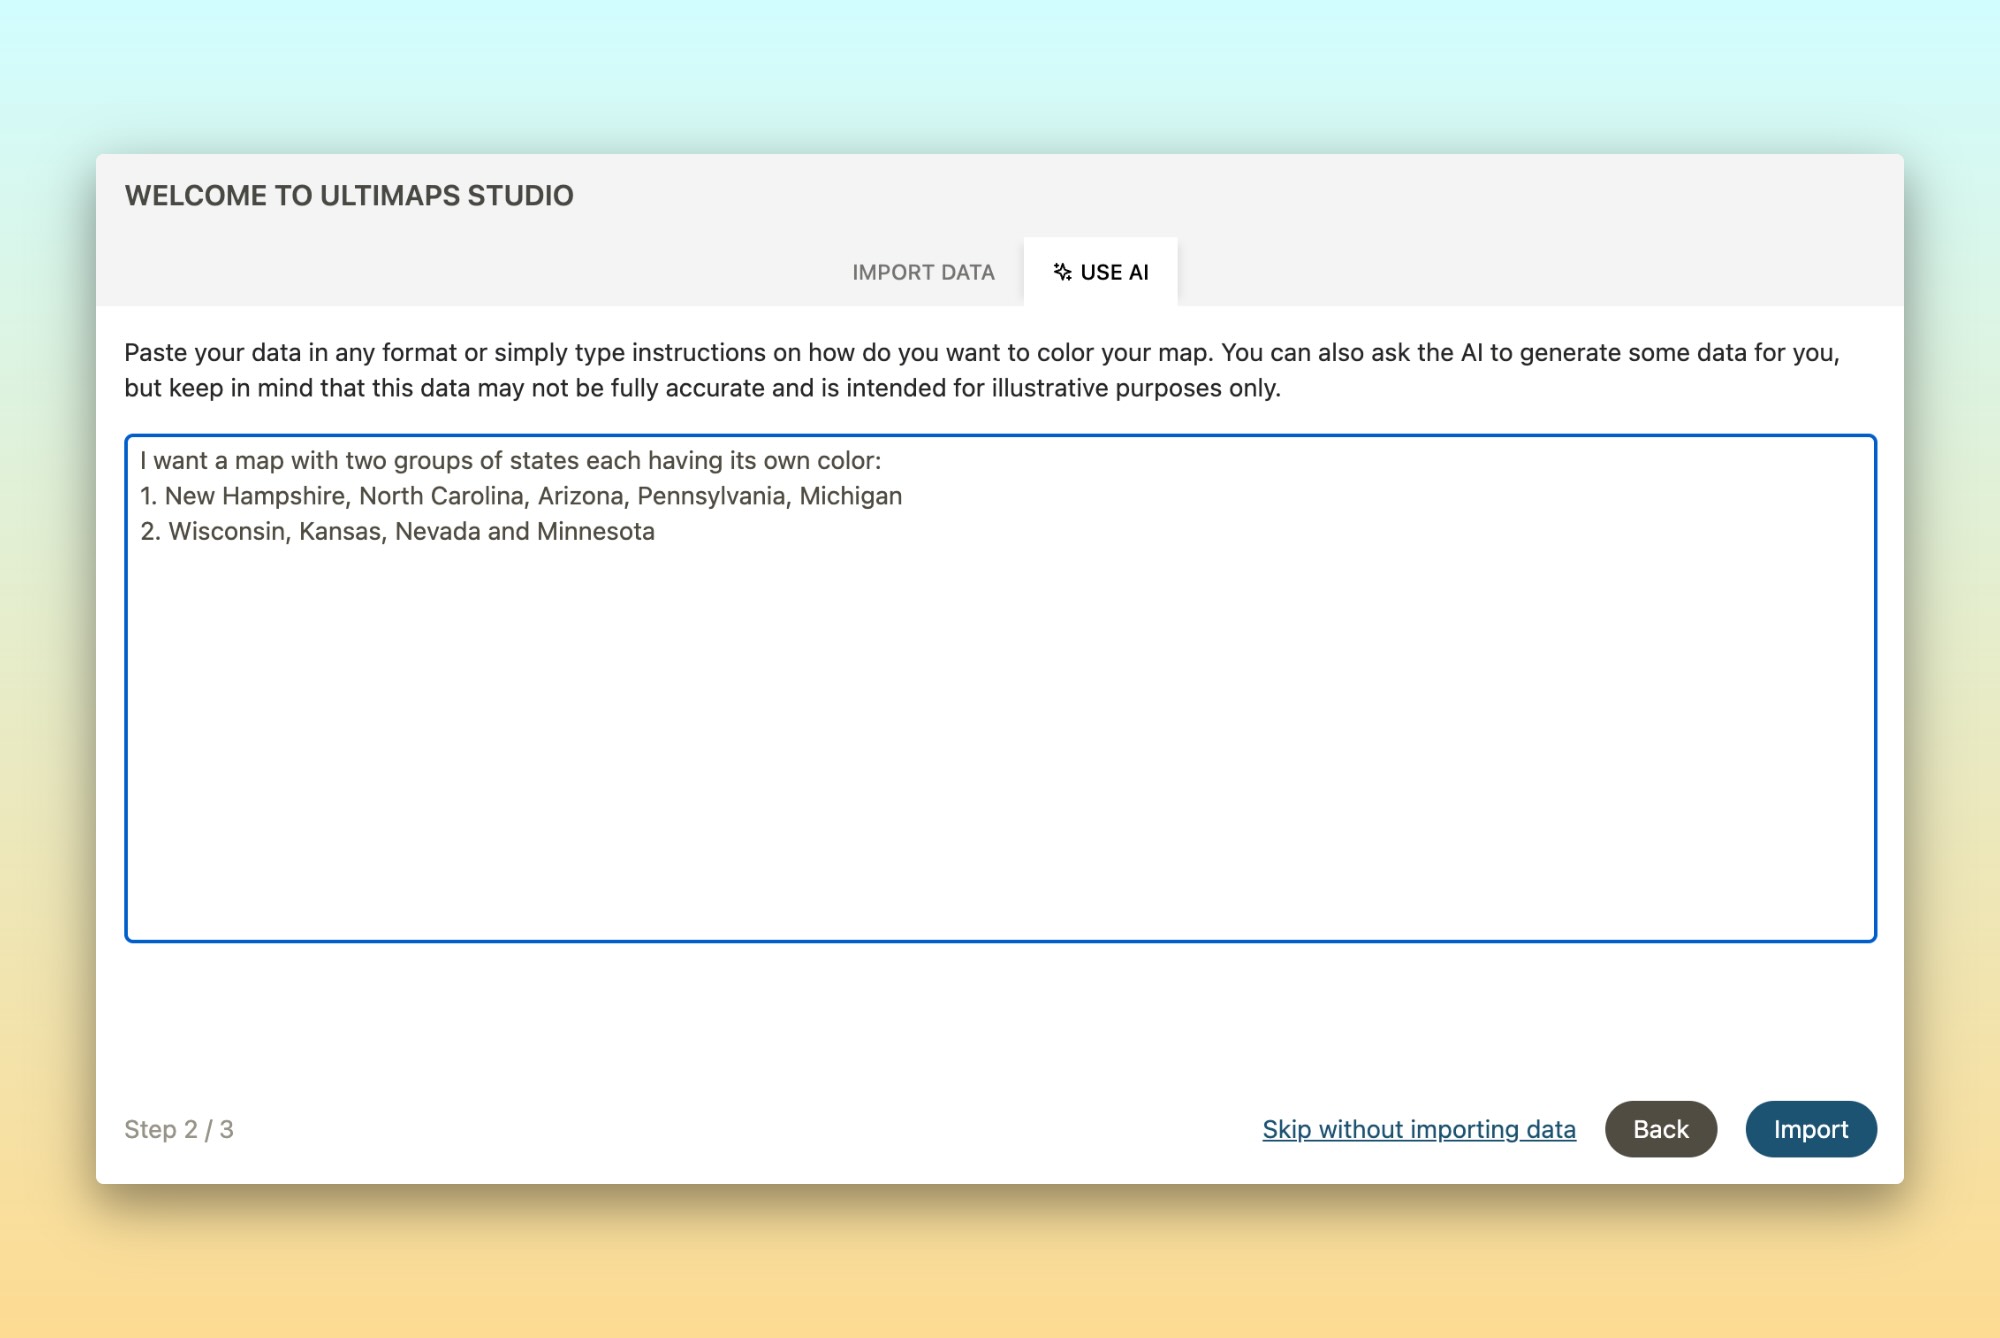
Here's how you can create a category map chart of the United States with some states in one category and some states in another:
I want two groups of states: NH, MA, NY in gold, and CA, TX, and NV in blue.
Or, this is how you can create a choropleth map chart of the world with the data you have in free text:
Top 10 countries with the highest number of AI startups in 2023:
- 🇺🇸 USA: 4,643
- 🇨🇳 China: 1,337
- 🇬🇧 UK: 630
- 🇮🇱 Israel: 402
- 🇨🇦 Canada: 341
- 🇫🇷 France: 338
- 🇮🇳 India: 296
- 🇯🇵 Japan: 294
- 🇩🇪 Germany: 245
- 🇸🇬 Singapore: 165
Additionally, you can ask AI to generate a data set for you, but keep in mind that this data may not be fully accurate and is intended for illustrative purposes only (however, it often produces legitimate data):
Color a map based on the winning party in the 2020 elections in the US.
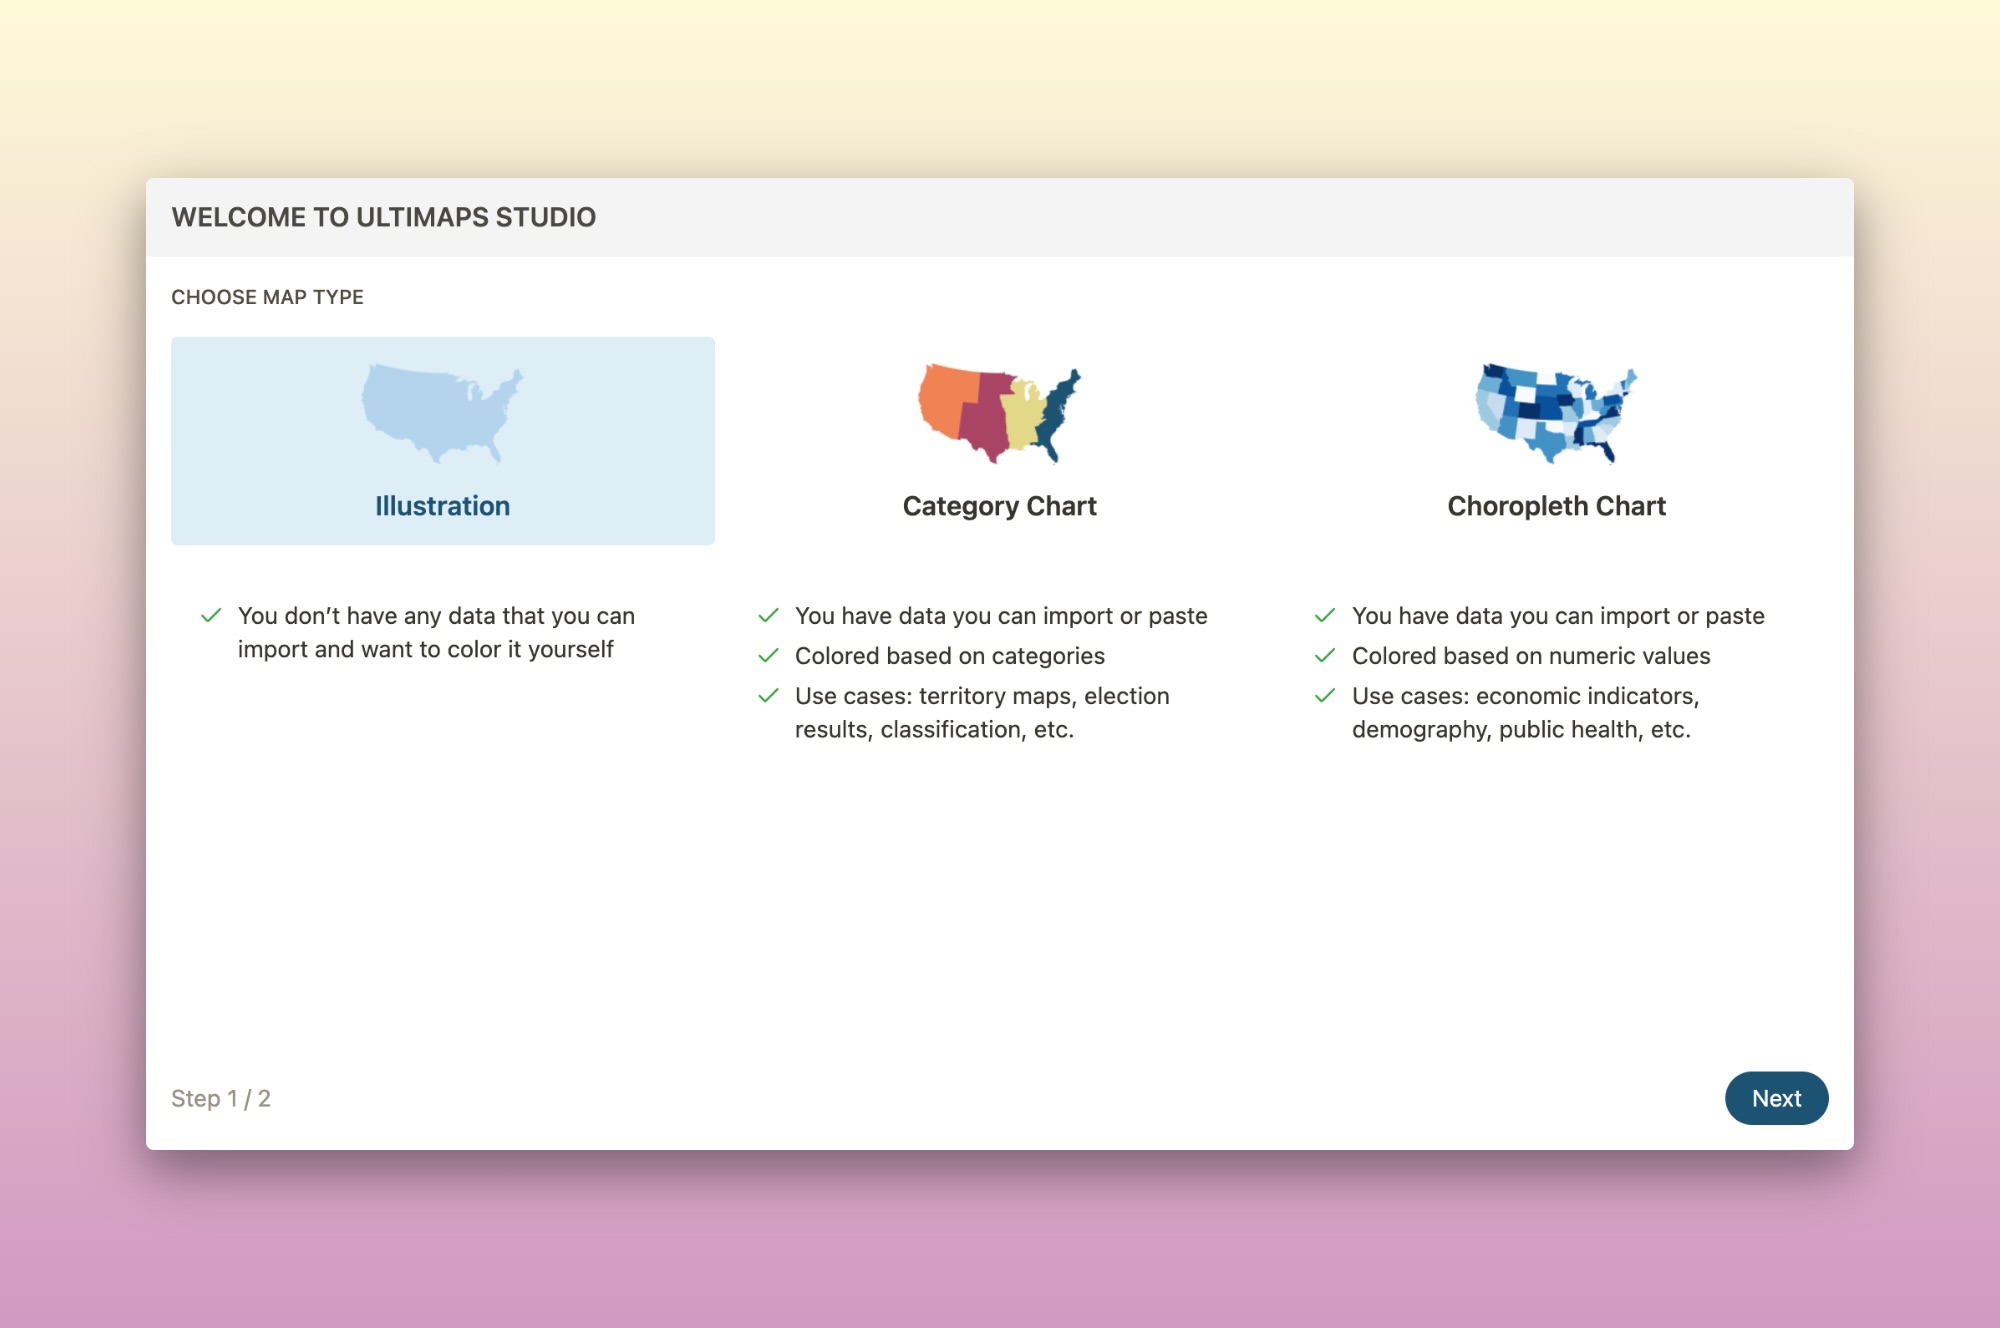
Improved Wizard
Our wizard has received a huge update. This is an important part of our app and kind of gives the first impression for new users. We collected feedback from our early adopters and actually learned that most of the time, our users don't need to import any data but rather want to color the maps themselves. We added a missing step to the wizard, letting our users choose what kind of chart they want to build depending on the data they have.
Hiding and Reordering Categories
For category maps, you can now reorder categories to make them appear in a specific order on the legend. Also, categories can be temporarily hidden so that they won't be shown on the legend, and the regions linked with them won't be colored.
New Maps
Finally, with this update we released a couple of new maps:
Thank you for reading, and happy color-coding, everyone!
Published Apr 21, 2024