Ultimaps vs Flourish for maps
Choose Flourish if
you tell stories with data: animated maps, filters, time sliders, 3D globes and 40+ projections, next to the other charts in your story. Flourish is free to publish, with attribution and a public page for each project, and its paid plans come through Canva or a sales contract.
Choose Ultimaps if
you need a map file as well as a web map, a US county or ZIP map ready to fill, or rows that match by name without exact IDs, and you want a map from a pasted table, with the color scale and legend built for you and every detail editable after. Free Ultimaps PNGs download with a small "made with ultimaps.com" credit, and the Pro and one-map prices are on the page.
Compared on by the Ultimaps team. Sources below.
Try Ultimaps freeWhen Ultimaps fits better than Flourish
You need a file, not only an embed
Flourish's free plan has no image download, and on paid plans its SVG leaves out text and legends. Ultimaps exports a free PNG with a small "made with ultimaps.com" credit, and a clean SVG, PDF and high-resolution PNG with Pro or a €12.50 one-map pass.
Your map is US counties or ZIP codes
Flourish has region starting points for 65 countries and areas plus a GeoJSON library, and you upload anything else. Ultimaps has all ~3,100 US counties in one map, a county map for every state and ZIP code maps for every state, DC, Puerto Rico, Guam and the US Virgin Islands. Every Ultimaps base map is checked by hand against current official divisions and updated when they change.
Your data does not carry exact IDs
In Flourish, the values in your data must match the region geometry's IDs exactly, whether those are codes or names. Ultimaps matches each row to a region by name or code on import, so a column of state names is enough.
Prices you can see
Flourish publishes no prices. Presenter comes with a Canva Business or Enterprise plan, and Publisher and Enterprise go through sales. Ultimaps Pro is €49 a month or €499 a year, and a 24-hour pass for one map costs €12.50.
Ultimaps vs Flourish, feature by feature
Swipe the table sideways to see every column.
| Feature | Ultimaps | Flourish |
|---|---|---|
| Better on Ultimaps | ||
| Free exports | Partly. PNG at screen resolution, sharp for web pages and slides, with a small "made with ultimaps.com" credit. Print-size PNG (6×) with Pro or a one-map pass | No. Image downloads are part of paid plans[1] |
| US counties | Yes. All ~3,100 in one map, plus a county map for every state | Partly. Not among its built-in maps. Upload your own GeoJSON[2] |
| US ZIP codes | Yes. ZIP (Census ZCTA) maps for every state, DC, Puerto Rico, Guam and the US Virgin Islands, plus a national 3-digit map. No nationwide 5-digit map | Partly. Not among its built-in maps. Upload your own GeoJSON[2] |
| Matching rows to regions | Yes. Automatic, by region name or code | Partly. Region IDs must match exactly[3] |
| Color scale from numbers: Jenks natural breaks | Yes. Suggested from the data. Gradient, steps or groups. Equal interval, quantile, Jenks, pretty or custom | Yes. Linear, or bins: fixed-width, quantile or custom (Jenks is not listed)[4] |
| Paid plans | €12.50 ($14.90) for one map (24-hour pass), or Pro €49/month or €499/year | No public prices. Presenter comes with Canva Business or Enterprise[5] |
| API | Yes. Map image API with a keyless free tier | Partly. Enterprise only[5] |
| Region labels | Yes. Names, values or both. Drag, rename, resize or rotate any label right on the map. Crowded labels are listed for you to fix instead of hidden | Partly. From a data column. Overlapping labels are hidden by default, steered by priority and hide lists[6] |
| Both do it | ||
| Data import | Yes. CSV, TSV, Excel, Google Sheets, Notion or paste. AI from a prompt or a picture of a map | Yes. Excel or CSV upload, paste. Live Google Sheet on Publisher and up[7] |
| Pins | Yes. From addresses (geocoded), coordinates or a file | Yes. A points layer and a marker map template[2] |
| Text and arrows on the map | Yes. Free text, rectangles, lines with arrowheads and callouts tied to regions, anywhere on the canvas | Yes. Labels, text blocks, connector lines and arrows[8] |
| Embed on a website | Yes. Iframe, and share links that turn into live maps in Notion, WordPress, Ghost and Substack. Free with a small "made with ultimaps.com" credit | Yes. Script embed, iframe and oEmbed. Free embeds carry attribution[9] |
| SVG | Partly. Vector SVG with the title, legend and labels kept. €12.50 for one map, or Pro | Partly. Presenter and up, SVG templates only (text and legends are left out)[1] |
| Credit on free maps | "made with ultimaps.com" on free PNGs and embeds. None on Pro or a one-map pass export | Flourish credit on free embeds, which you may not remove. Removing it on websites needs Publisher[10] |
| AI | Yes. AI import from a prompt or a picture of a map. 20 AI requests a month free | Yes. Flourish Assistant on every plan, with a tiered allowance[5] |
| Maps from ChatGPT and Claude | Yes. Our own MCP server, free. In ChatGPT's app directory, added to Claude by URL, no account or key to start | Partly. Flourish Connector for MCP tools. Plans not stated[5] |
| Where Flourish goes further | ||
| Interactive maps | Yes. Tooltips, popups, click-through links, zoom and an interactive legend | Yes. Hover, click, zoom, popups, filters, time slider, animation[2] |
| Your own boundaries | No. You cannot upload them. Custom maps made to order, from €49 per map with no subscription | Yes. Upload GeoJSON, about 5 MB[11] |
Not stated means the tool’s own pages do not say, or we could not confirm it. Numbers in brackets link to the source.
Pricing: Ultimaps vs Flourish
Both are free to start. Flourish keeps its paid prices off its site. Ultimaps lists its prices: a pass for one map, or Pro monthly or yearly.
| Flourish plan | Price |
|---|---|
| Free: All templates, unlimited projects. Published projects are public and carry attribution. No image downloads. | US$0[5] |
| Presenter: Adds PNG, JPEG and SVG downloads. | Comes with a Canva Business or Enterprise plan[5] |
| Publisher | Contact sales[5] |
| Enterprise | Contact sales[5] |
Ultimaps plans
Free
€0
Free forever
Make maps from your data and share them. No card, and no sign-up until you save or publish.
No sign-up or card needed
What’s included
- Unlimited maps
- Import Excel, CSV, Sheets or Notion
- 100 address lookups + 20 AI requests a month
- PNG export with credit
- Commercial use with the credit
- Interactive maps you can embed
Pro
: Save 15%Billed monthly: €49. Billed yearly: €41.58/month
Billed €499 yearly
For professionals who publish maps often. Pays for itself from about 4 maps a month.
Cancel anytime
Everything in Free, plus
- Unlimited exports, no credit
- 6× resolution PNG, plus SVG and PDF
- Unbranded interactive maps
- Templates and duplicates
- 5,000 lookups + 500 AI requests a month
- Priority email support
Custom
Custom
Tailored to your needs
For organizations that need maps in their own brand, a map we don't have or custom map behavior.
Custom maps from €49 per map
Everything in Pro, plus
- Custom maps for any region
- Custom themes and fonts
- Invite users to your workspace
- Custom interactive logic
Just one map? €12.50 per map
High-res PNG, SVG and PDF with no credit. The files are yours to use commercially, forever, and you can re-export that map for 24 hours.
Exporting 4 or more maps a month? Pro costs less.
No card for Free · Cancel anytime, Pro runs to the end of your paid period · 30% off for non-profits

The same data in both tools
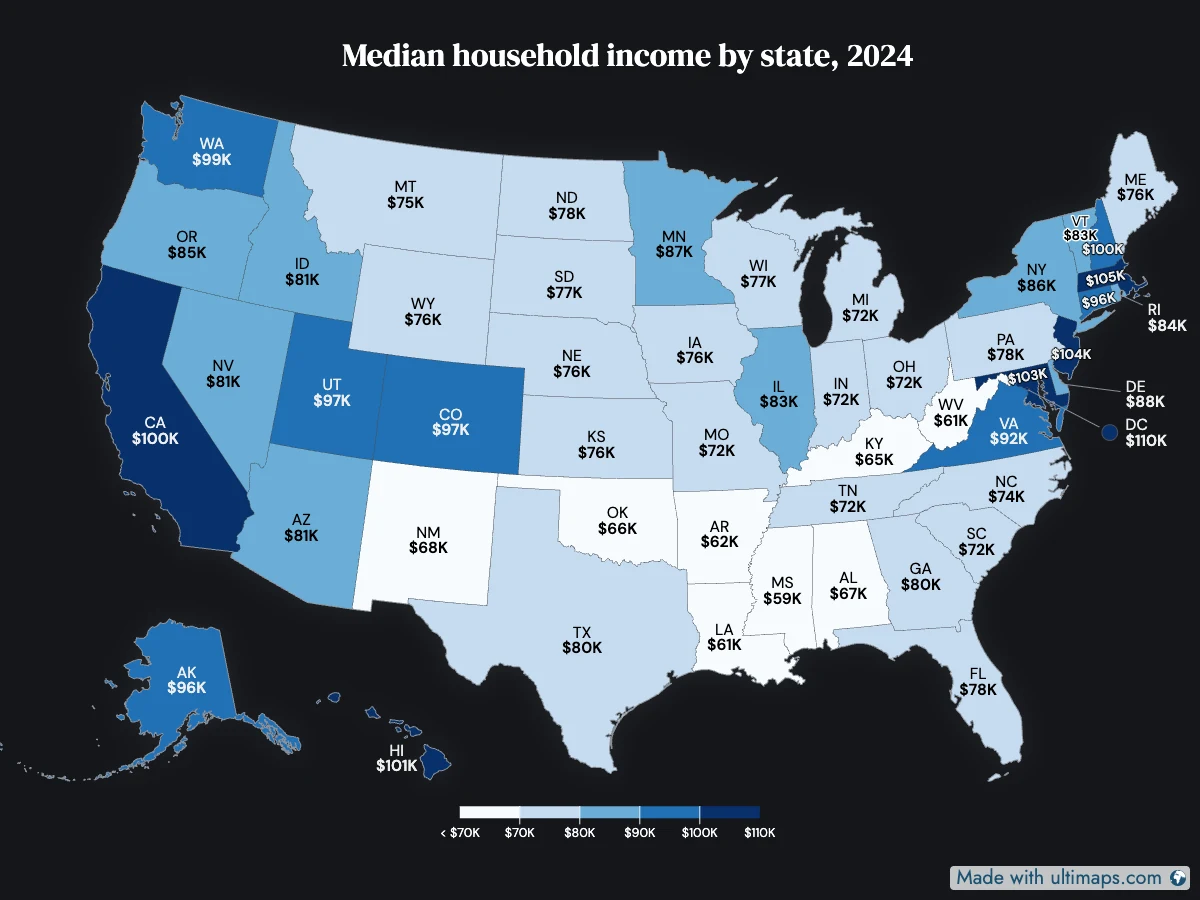
One table, two tools: median household income in all 50 states and DC in 2024, from the Census Bureau's American Community Survey. Download the CSV and try both yourself.
In Ultimaps
- Open Studio, start a United States map and open Import Data.
- Paste the two columns (state and income) or upload the CSV. All 51 rows match by state name.
- Ultimaps suggests a color scale and builds the legend. Set the number format to currency so the legend reads in dollars.
- Add a popup template that shows the income, then publish and embed the map, or export a PNG.
In Flourish
- Start a Projection map and pick the USA region starting point.
- Upload or paste the table. Each state must match an ID in the region geometry exactly, as a code or a name.
- Switch the color scale from categorical to sequential, then choose linear or bins (fixed-width, quantile or custom).
- Publish to embed the map with Flourish attribution. Image downloads need a paid plan.
Flourish’s own guide: Projection map: an overview
Switching from Flourish
Bring the data, not the project.
- Open the spreadsheet you built the Flourish map from.
- In Ultimaps Studio, start the matching base map and import the file. Rows match by region name or code, so your values no longer have to match the geometry's IDs exactly.
- Pick the column that colors the map. Keep the rest for tooltips and popups, written as templates with your column names.
- Publish, then swap the Flourish embed for the Ultimaps iframe, or paste the map link into Notion, WordPress, Ghost or Substack.
Where Flourish is still ahead
- Storytelling: animation, time sliders, filters and stories, with maps among 50+ templates in all.
- 3D maps and globes, heatmaps, connection globes and 40+ projections.
- Your own boundaries: upload GeoJSON of about 5 MB. Ultimaps has no upload. We make custom maps to order, from €49 per map with no subscription.
- Canva: on Presenter, which comes with Canva Business or Enterprise, interactive Flourish charts go into Canva designs without attribution.
Ultimaps vs Flourish: questions
More comparisons
Ultimaps vs Datawrapper
Thousands of basemaps and charts in one tool, or popups, hand coloring and one clean map without a subscription.
Ultimaps vs MapChart
Hand coloring and free 10,000 px exports, or data import, pins and maps you embed.
MapChart alternatives
Nine map makers for people who outgrew hand coloring, each with its free plan, price and best use.
Sources
- [1]helpcenter.flourish.studio/hc/en-us/articles/8761545595791-Understanding-image-download-options, checked November 6, 2026
- [2]flourish.studio/visualisations/maps/, checked November 6, 2026
- [3]helpcenter.flourish.studio/hc/en-us/articles/8761575205263-How-to-color-your-map-regions, checked November 6, 2026
- [4]helpcenter.flourish.studio/hc/en-us/articles/8827922007055-How-to-add-custom-colors-and-thresholds-to-your-map-and-legend, checked November 6, 2026
- [5]flourish.studio/pricing/, checked November 6, 2026
- [6]helpcenter.flourish.studio/hc/en-us/articles/8761575430159-How-to-add-region-labels-to-your-Projection-map, checked November 8, 2026
- [7]helpcenter.flourish.studio/hc/en-us/articles/8761562464911-Projection-map-an-overview, checked November 6, 2026
- [8]helpcenter.flourish.studio/hc/en-us/articles/8827970654351-How-to-add-annotations-to-your-visualization, checked November 8, 2026
- [9]helpcenter.flourish.studio/hc/en-us/articles/8761559763343-Understanding-the-difference-between-Flourish-s-embed-options, checked November 6, 2026
- [10]flourish.studio/terms/, checked November 6, 2026
- [11]helpcenter.flourish.studio/hc/en-us/articles/8827954135951-How-to-add-your-own-map-regions, checked November 6, 2026
Ultimaps figures are from our own product as of November 8, 2026.
Ultimaps is not affiliated with Flourish. Flourish is a trademark of its owner. Figures were read from Flourish’s own pages, linked above, on the dates shown. If something here is wrong or out of date, write to [email protected] and we will correct it.
- : Re-checked: free-plan credits stated for every tool, Ultimaps export and MCP rows added, claims where other tools lead re-verified.
- : First published. Flourish facts checked on its own site on November 6, 2026.