Map Image API

Data in, map image out. One URL renders a choropleth, category or pin map of any country, state, county or ZIP area as a PNG. No account, no key, no map library in your stack.

GET, no key
https://api.ultimaps.com/v1/renders?spec=%7B%22mapId%22%3A%22united-states%22%2C%22regions%22%3A%7B%22US-CA%22%3A%22%231D4ED8%22%2C%22US-TX%22%3A%22%23F59E0B%22%2C%22New%20York%22%3A%22%2310B981%22%7D%2C%22title%22%3A%7B%22text%22%3A%22Where%20we%20operate%22%7D%2C%22style%22%3A%7B%22labels%22%3A%7B%22show%22%3Atrue%7D%7D%2C%22output%22%3A%7B%22width%22%3A1200%7D%7D

That is the whole request. The spec parameter is URL-encoded JSON, and the response is the image itself, so the URL drops straight into an <img> tag, a README, a Notion page or a spreadsheet cell.

GET is the shorthand, and it caps at a 6KB spec. Send the same JSON to POST /v1/renders for the rest: up to 5,000 regions, break methods and palettes, legends, pins, themes, extra layers, dry runs, and SVG with a Pro key.

It renders maps. It does not create maps in your account, publish interactive maps, or geocode addresses. See what is not in v1.

US map rendered by the Ultimaps API, every state labelled, with California, Texas and New York filled in
Rendered live by the URL on the left, cached for 24 hours.

Cookbook

Six complete requests. Every one is validated against the live request schema in CI, so you can copy them as they are, swap the mapId and the values, and go. Each image is the response the request next to it returned, watermark included, on the free keyless tier.

Highlight a few regions

The simplest useful request. You name regions and give each one a color. Everything else takes the map default.

Request body
{
  "mapId": "united-states",
  "regions": {
    "US-CA": "#1D4ED8",
    "US-TX": "#F59E0B",
    "New York": "#10B981"
  },
  "title": {
    "text": "Where we operate"
  },
  "style": {
    "labels": {
      "show": true
    }
  },
  "output": {
    "width": 1200
  }
}
curl
curl https://api.ultimaps.com/v1/renders \
  -H "Content-Type: application/json" \
  -d '{
    "mapId": "united-states",
    "regions": {
      "US-CA": "#1D4ED8",
      "US-TX": "#F59E0B",
      "New York": "#10B981"
    },
    "title": {
      "text": "Where we operate"
    },
    "style": {
      "labels": {
        "show": true
      }
    },
    "output": {
      "width": 1200
    }
  }' \
  -o map.png
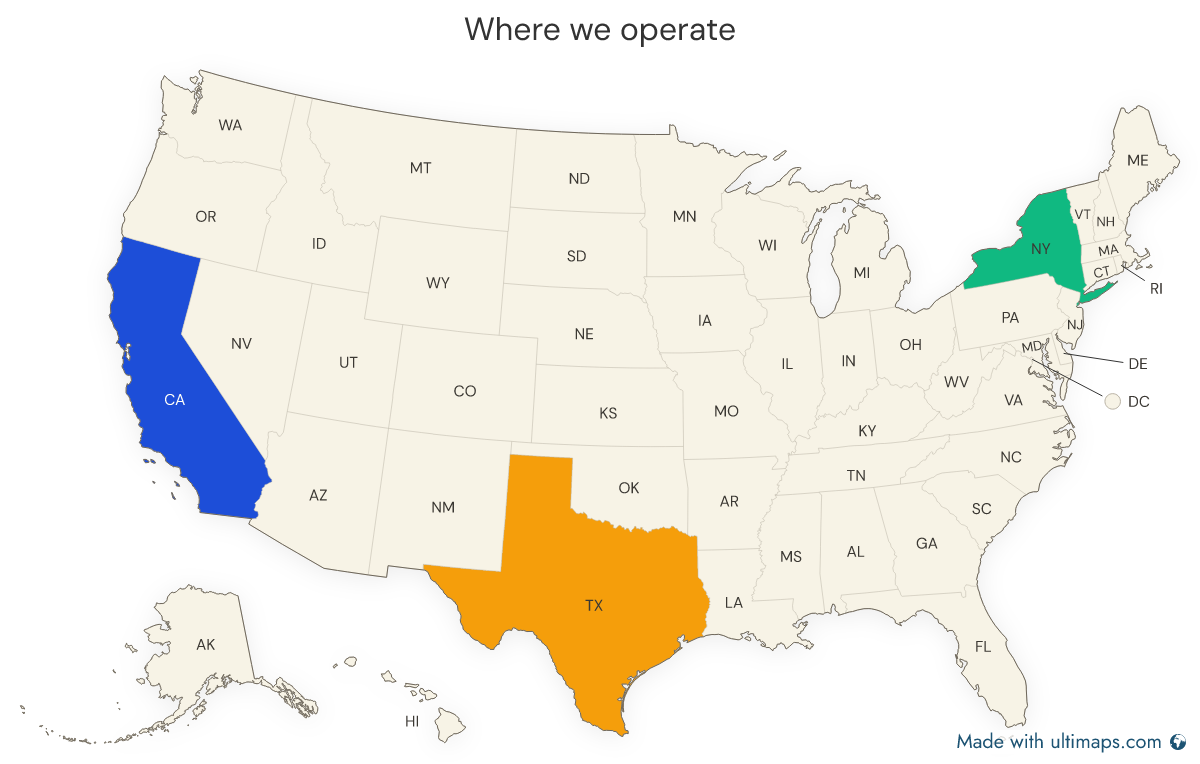
Map of the United States titled "Where we operate", with California blue, Texas orange and New York green, every other state in the theme default and labelled with its abbreviation
  • Region keys are flexible. "US-CA", "California" and "CA" all reach the same region.
  • Colors are hex strings. Regions you leave out keep the theme default.
  • "style.labels.show" prints every region name. There is no way to label only the regions you colored.
Open this render in a new tab

Choropleth from numbers

Give the API raw values and it picks the classes, the colors and the legend. This is the request most people want.

Request body
{
  "mapId": "united-states",
  "choropleth": {
    "values": {
      "California": 39.5,
      "Texas": 30.5,
      "Florida": 22.6,
      "New York": 19.6,
      "Pennsylvania": 13,
      "Illinois": 12.5,
      "Ohio": 11.8,
      "Georgia": 11,
      "North Carolina": 10.8,
      "Michigan": 10
    },
    "type": "groups",
    "palette": "blues",
    "classes": 5,
    "method": "quantile",
    "noDataColor": "#EEEEEE",
    "format": {
      "decimals": 1,
      "suffix": "M"
    }
  },
  "legend": {
    "position": "left"
  },
  "title": {
    "text": "Population by state, 2025"
  },
  "style": {
    "labels": {
      "show": true,
      "content": "value"
    }
  },
  "output": {
    "width": 1600,
    "scale": 1
  }
}
curl
curl https://api.ultimaps.com/v1/renders \
  -H "Content-Type: application/json" \
  -d '{
    "mapId": "united-states",
    "choropleth": {
      "values": {
        "California": 39.5,
        "Texas": 30.5,
        "Florida": 22.6,
        "New York": 19.6,
        "Pennsylvania": 13,
        "Illinois": 12.5,
        "Ohio": 11.8,
        "Georgia": 11,
        "North Carolina": 10.8,
        "Michigan": 10
      },
      "type": "groups",
      "palette": "blues",
      "classes": 5,
      "method": "quantile",
      "noDataColor": "#EEEEEE",
      "format": {
        "decimals": 1,
        "suffix": "M"
      }
    },
    "legend": {
      "position": "left"
    },
    "title": {
      "text": "Population by state, 2025"
    },
    "style": {
      "labels": {
        "show": true,
        "content": "value"
      }
    },
    "output": {
      "width": 1600,
      "scale": 1
    }
  }' \
  -o map.png
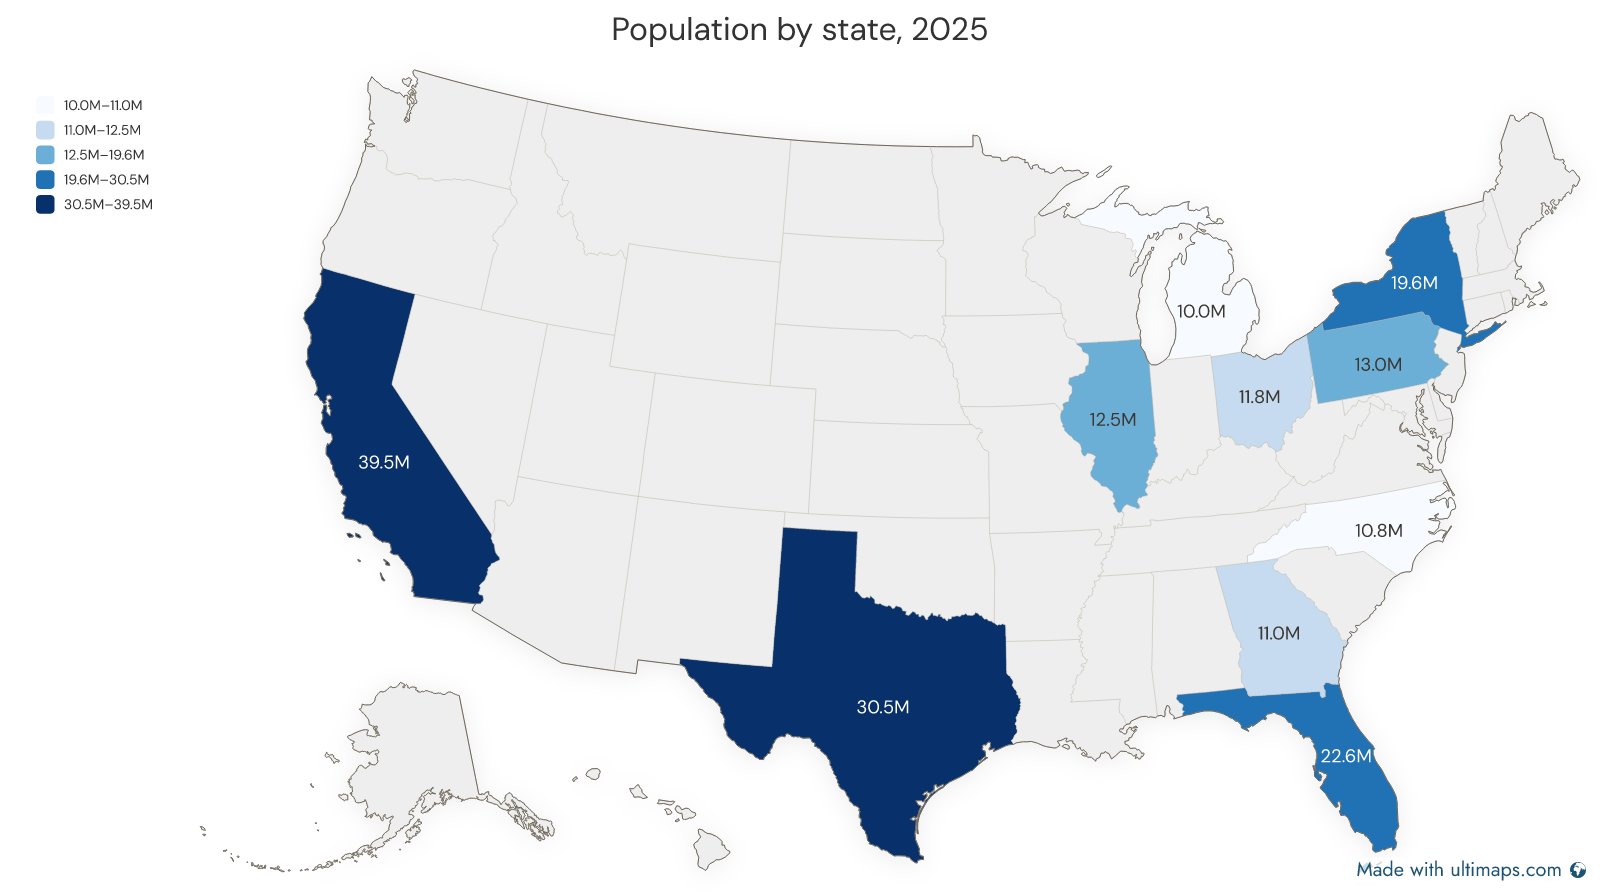
Choropleth map of US state population in 2025, shaded across five blue quantile classes with the break labels in a legend and each value printed in millions on its state
  • Leave out "type", "classes" and "method" and the API detects them from your data.
  • "palette" takes any of the 26 built-in palettes. "noDataColor" paints regions your data does not cover.
  • "format" controls the break labels in the legend, not the image format.

Open this render in a new tab

Categories instead of numbers

For statuses, tiers, owners, coverage: text values instead of numbers. Colors are optional, the API assigns them if you skip them.

Request body
{
  "mapId": "germany",
  "categories": {
    "values": {
      "DE-BE": "Live",
      "DE-HH": "Live",
      "DE-NW": "Live",
      "DE-BY": "Pilot",
      "DE-HE": "Pilot",
      "DE-SN": "Planned",
      "DE-NI": "Planned"
    },
    "colors": {
      "Live": "#16A34A",
      "Pilot": "#F59E0B",
      "Planned": "#94A3B8"
    }
  },
  "legend": {
    "position": "right"
  },
  "style": {
    "theme": "paper",
    "labels": {
      "show": true
    }
  }
}
curl
curl https://api.ultimaps.com/v1/renders \
  -H "Content-Type: application/json" \
  -d '{
    "mapId": "germany",
    "categories": {
      "values": {
        "DE-BE": "Live",
        "DE-HH": "Live",
        "DE-NW": "Live",
        "DE-BY": "Pilot",
        "DE-HE": "Pilot",
        "DE-SN": "Planned",
        "DE-NI": "Planned"
      },
      "colors": {
        "Live": "#16A34A",
        "Pilot": "#F59E0B",
        "Planned": "#94A3B8"
      }
    },
    "legend": {
      "position": "right"
    },
    "style": {
      "theme": "paper",
      "labels": {
        "show": true
      }
    }
  }' \
  -o map.png
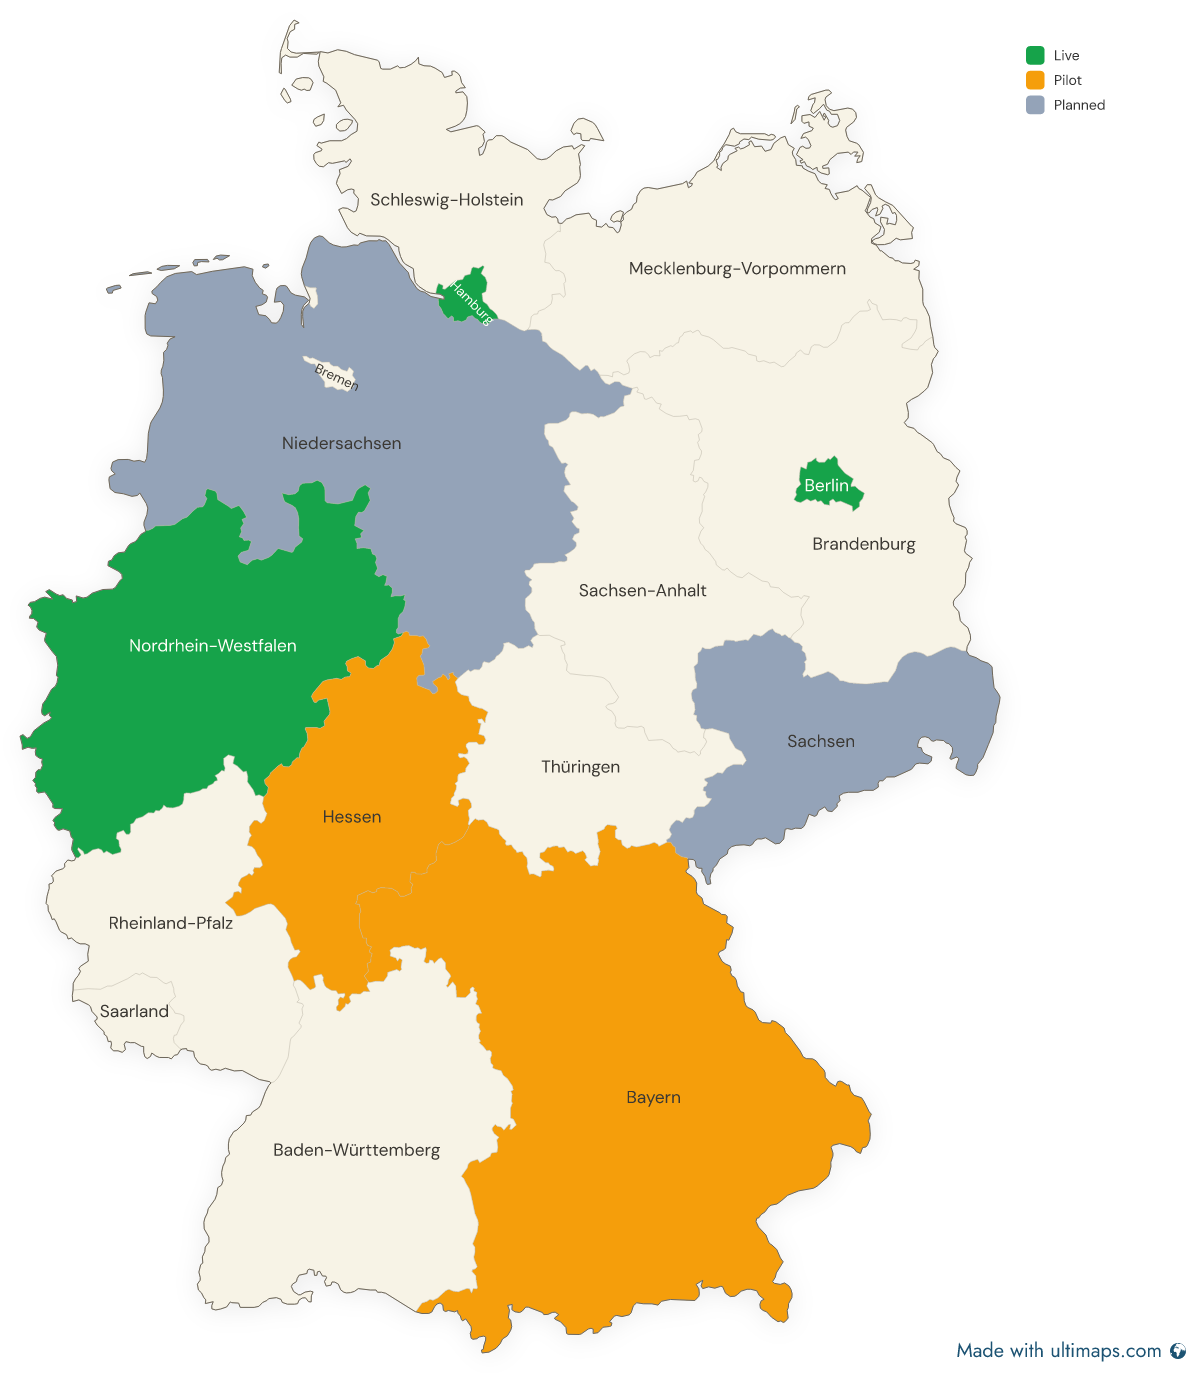
Map of Germany with its states coloured by rollout status — green for live, amber for pilot, grey for planned — beside a legend naming the three categories
  • Use "choropleth" or "categories", not both. One scale per map.
  • "style.labels.show" prints the region names on the map.

Open this render in a new tab

Pins

Latitude and longitude markers. Pins compose with everything else, so you can drop them on a choropleth or on a plain map.

SVG output needs a Pro key. Drop "format" for PNG on any tier.

Request body
{
  "mapId": "united-states",
  "style": {
    "theme": "paper",
    "defaultRegionColor": "#F1F5F9"
  },
  "locations": [
    {
      "title": "Austin HQ",
      "lat": 30.2672,
      "lon": -97.7431,
      "color": "#1D4ED8"
    },
    {
      "title": "Denver",
      "lat": 39.7392,
      "lon": -104.9903,
      "labelPosition": "right"
    },
    {
      "title": "Seattle",
      "lat": 47.6062,
      "lon": -122.3321
    }
  ],
  "output": {
    "width": 1400,
    "format": "svg"
  }
}
curl
curl https://api.ultimaps.com/v1/renders \
  -H "Content-Type: application/json" \
  -d '{
    "mapId": "united-states",
    "style": {
      "theme": "paper",
      "defaultRegionColor": "#F1F5F9"
    },
    "locations": [
      {
        "title": "Austin HQ",
        "lat": 30.2672,
        "lon": -97.7431,
        "color": "#1D4ED8"
      },
      {
        "title": "Denver",
        "lat": 39.7392,
        "lon": -104.9903,
        "labelPosition": "right"
      },
      {
        "title": "Seattle",
        "lat": 47.6062,
        "lon": -122.3321
      }
    ],
    "output": {
      "width": 1400,
      "format": "svg"
    }
  }' \
  -o map.svg
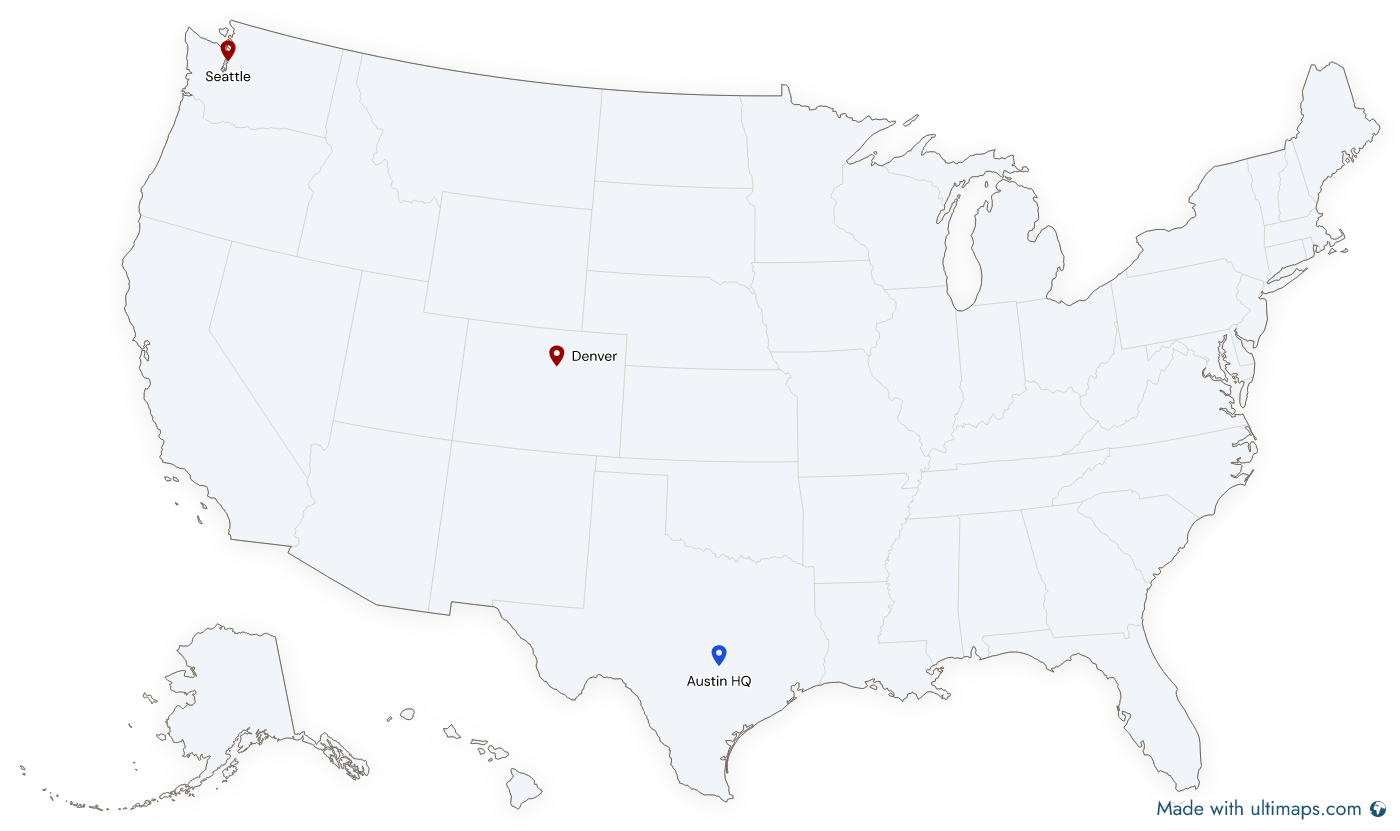
Map of the United States on a pale theme with labelled pins on Austin, Denver and Seattle, the Austin pin in blue and the other two in the default red
Shown as PNG — the request asks for SVG. Same map either way.
  • Each pin takes its own color, label side and label visibility.
  • Pins are placed by coordinates. The API does not geocode addresses.

SVG needs a Pro key. The keyless GET path returns PNG only.

Check a request before you render it

Dry run returns JSON instead of an image: which of your keys matched, which did not, what got corrected and what the breaks came out as. It costs no quota.

Request body
{
  "mapId": "united-states",
  "choropleth": {
    "values": {
      "Calfornia": 39.5,
      "Texas": 30.5,
      "Florida": 22.6,
      "Atlantis": 1
    }
  },
  "dryRun": true
}
curl
curl https://api.ultimaps.com/v1/renders \
  -H "Content-Type: application/json" \
  -d '{
    "mapId": "united-states",
    "choropleth": {
      "values": {
        "Calfornia": 39.5,
        "Texas": 30.5,
        "Florida": 22.6,
        "Atlantis": 1
      }
    },
    "dryRun": true
  }'
  • The typo "Calfornia" comes back corrected to California. "Atlantis" comes back unmatched.
  • Use this while you wire up your data, then flip "dryRun" off.

Dry runs are POST only. The keyless GET path rejects dryRun.

Fail on bad keys instead of guessing

By default unmatched keys are skipped. Set "onUnmatched" to "error" and the API returns a 400 with per-key suggestions, which is what you want in a scheduled job.

Request body
{
  "mapId": "united-states",
  "choropleth": {
    "values": {
      "California": 39.5,
      "Texassss": 30.5,
      "Atlantis": 1
    }
  },
  "onUnmatched": "error"
}
curl
curl https://api.ultimaps.com/v1/renders \
  -H "Content-Type: application/json" \
  -d '{
    "mapId": "united-states",
    "choropleth": {
      "values": {
        "California": 39.5,
        "Texassss": 30.5,
        "Atlantis": 1
      }
    },
    "onUnmatched": "error"
  }' \
  -o map.png
  • The 400 is an RFC 9457 problem document. Branch on "code", not on the message.

Open the 400 this returns

Full field reference, including all 26 palettes, the four break methods, themes, extra layers and number formatting: the API reference.

Maps you can render

187 maps, from world and continent maps down to US counties and ZIP code areas. The mapId is the map's slug on this site, and it never changes once it is published.

united-states-canadafrance-departmentsindiaeuropecanadaunited-statesunited-arab-emiratesunited-kingdom-countiesworld

Keys and limits

A key raises the rate limits and the canvas size. A Pro key removes the watermark and unlocks SVG. Create one in Studio under Workspace, then API. Keys are shown once.

Keyed request
curl https://api.ultimaps.com/v1/renders \
  -H "Authorization: Bearer $ULTIMAPS_API_KEY" \
  -H "Content-Type: application/json" \
  -d '{
    "mapId": "united-states",
    "choropleth": {
      "values": {
        "California": 39.5,
        "Texas": 30.5,
        "Florida": 22.6,
        "New York": 19.6,
        "Pennsylvania": 13,
        "Illinois": 12.5,
        "Ohio": 11.8,
        "Georgia": 11,
        "North Carolina": 10.8,
        "Michigan": 10
      },
      "type": "groups",
      "palette": "blues",
      "classes": 5,
      "method": "quantile",
      "noDataColor": "#EEEEEE",
      "format": {
        "decimals": 1,
        "suffix": "M"
      }
    },
    "legend": {
      "position": "left"
    },
    "title": {
      "text": "Population by state, 2025"
    },
    "style": {
      "labels": {
        "show": true,
        "content": "value"
      }
    },
    "output": {
      "width": 1600,
      "scale": 1
    }
  }' \
  -o map.png
TierAuthFormatsAttributionCanvasRate limitMonthly
KeylessnonePNGfull watermark≤ 1600 px, scale 130/hour per IP, burst 5/minno monthly cap
Free keyBearer um_live_…PNGfull watermark≤ 1600 px, scale ≤ 210/min, 50/day500 renders
Pro keyBearer um_live_…PNG, SVGnone≤ 4000 px, scale ≤ 430/min, 1,000/day5,000 renders

Monthly quota is a billing state and returns 402, never retryable. Rate and concurrency limits return 429 with Retry-After. Dry runs never consume quota. Check GET /v1/usage for where you stand.

Not in v1

v1 renders images. It does not do any of this:

  • Creating or saving maps to an account
  • Publishing interactive or embeddable maps
  • PDF output
  • Geocoding addresses to coordinates
  • Reading back the geometry behind a map

If you need one of these, tell us which and we will let you know when it exists. What people ask for here is what we build next.

Reference

Frequently Asked Questions

Yes, that is the main thing this API does. Post a set of region keys and numbers and you get back a classified, colored, legended map as a PNG. The API picks the break method, the class count and the palette from your data unless you set them yourself.

Put your request JSON in the spec query parameter of GET /v1/renders and the response is the PNG itself. That URL works in an img tag, a markdown image, a Notion image block or a Google Sheets IMAGE() formula, with no key and no account.

Yes. The keyless tier renders PNG up to 1600 by 1600 pixels at 30 renders per hour per IP, with an Ultimaps watermark. A key raises the limits, and a Pro key removes the watermark and adds SVG.

It renders county maps as images, including all 3,143 US counties, but it does not serve boundary geometry. If you need GeoJSON or shapefiles to process yourself, use Census TIGER or Natural Earth instead. This API returns pictures.

No. Pins are placed by latitude and longitude, and region colors are matched by region key or name. Geocoding is a Studio feature, not an API one.

Yes, with a Pro key. Set output.format to svg. Keyless and free keys return PNG.

Keys are matched case-insensitively against region codes, titles, common aliases and normalized titles, so US-CA, California and CA all reach the same region, and unambiguous typos are corrected and reported. By default unmatched keys are skipped and reported in a response header. Set onUnmatched to error and the request fails with per-key suggestions instead.

Use the keyless GET URL as a markdown image. GitHub proxies it through Camo, and because the API sends a 24 hour cache header the image refreshes daily rather than freezing.

Yes. Every render happens on our servers, so there is no browser, no headless Chrome and no map library in your stack. A single HTTP call returns the finished image.